Balancing nutrient diets determines how ecosystems age

From rainforests to rocky glaciers, the life of an ecosystem is rooted in the balance of nutrients in its soil. Shifting levels of soil nitrogen (N) and phosphorus (P) define how ecosystems evolve, and understanding the dynamics of these key nutrients can help ecologists identify crucial factors to help mitigate climate change.
A new model to understand N and P dynamics over different time scales was described in the PLOS ONE paper, “Nitrogen and Phosphorus Limitation over Long-term Ecosystem Development in Terrestrial Ecosystems”. Recently awarded the Ecological Society of America’s prize for an outstanding theoretical ecology paper, the study determines whether N or P are more likely to limit the productivity of ecosystems over short, intermediate and long timescales. Author Duncan Menge explains the background and results of their study:
How do N and P levels change with the age of an ecosystem like a rainforest?
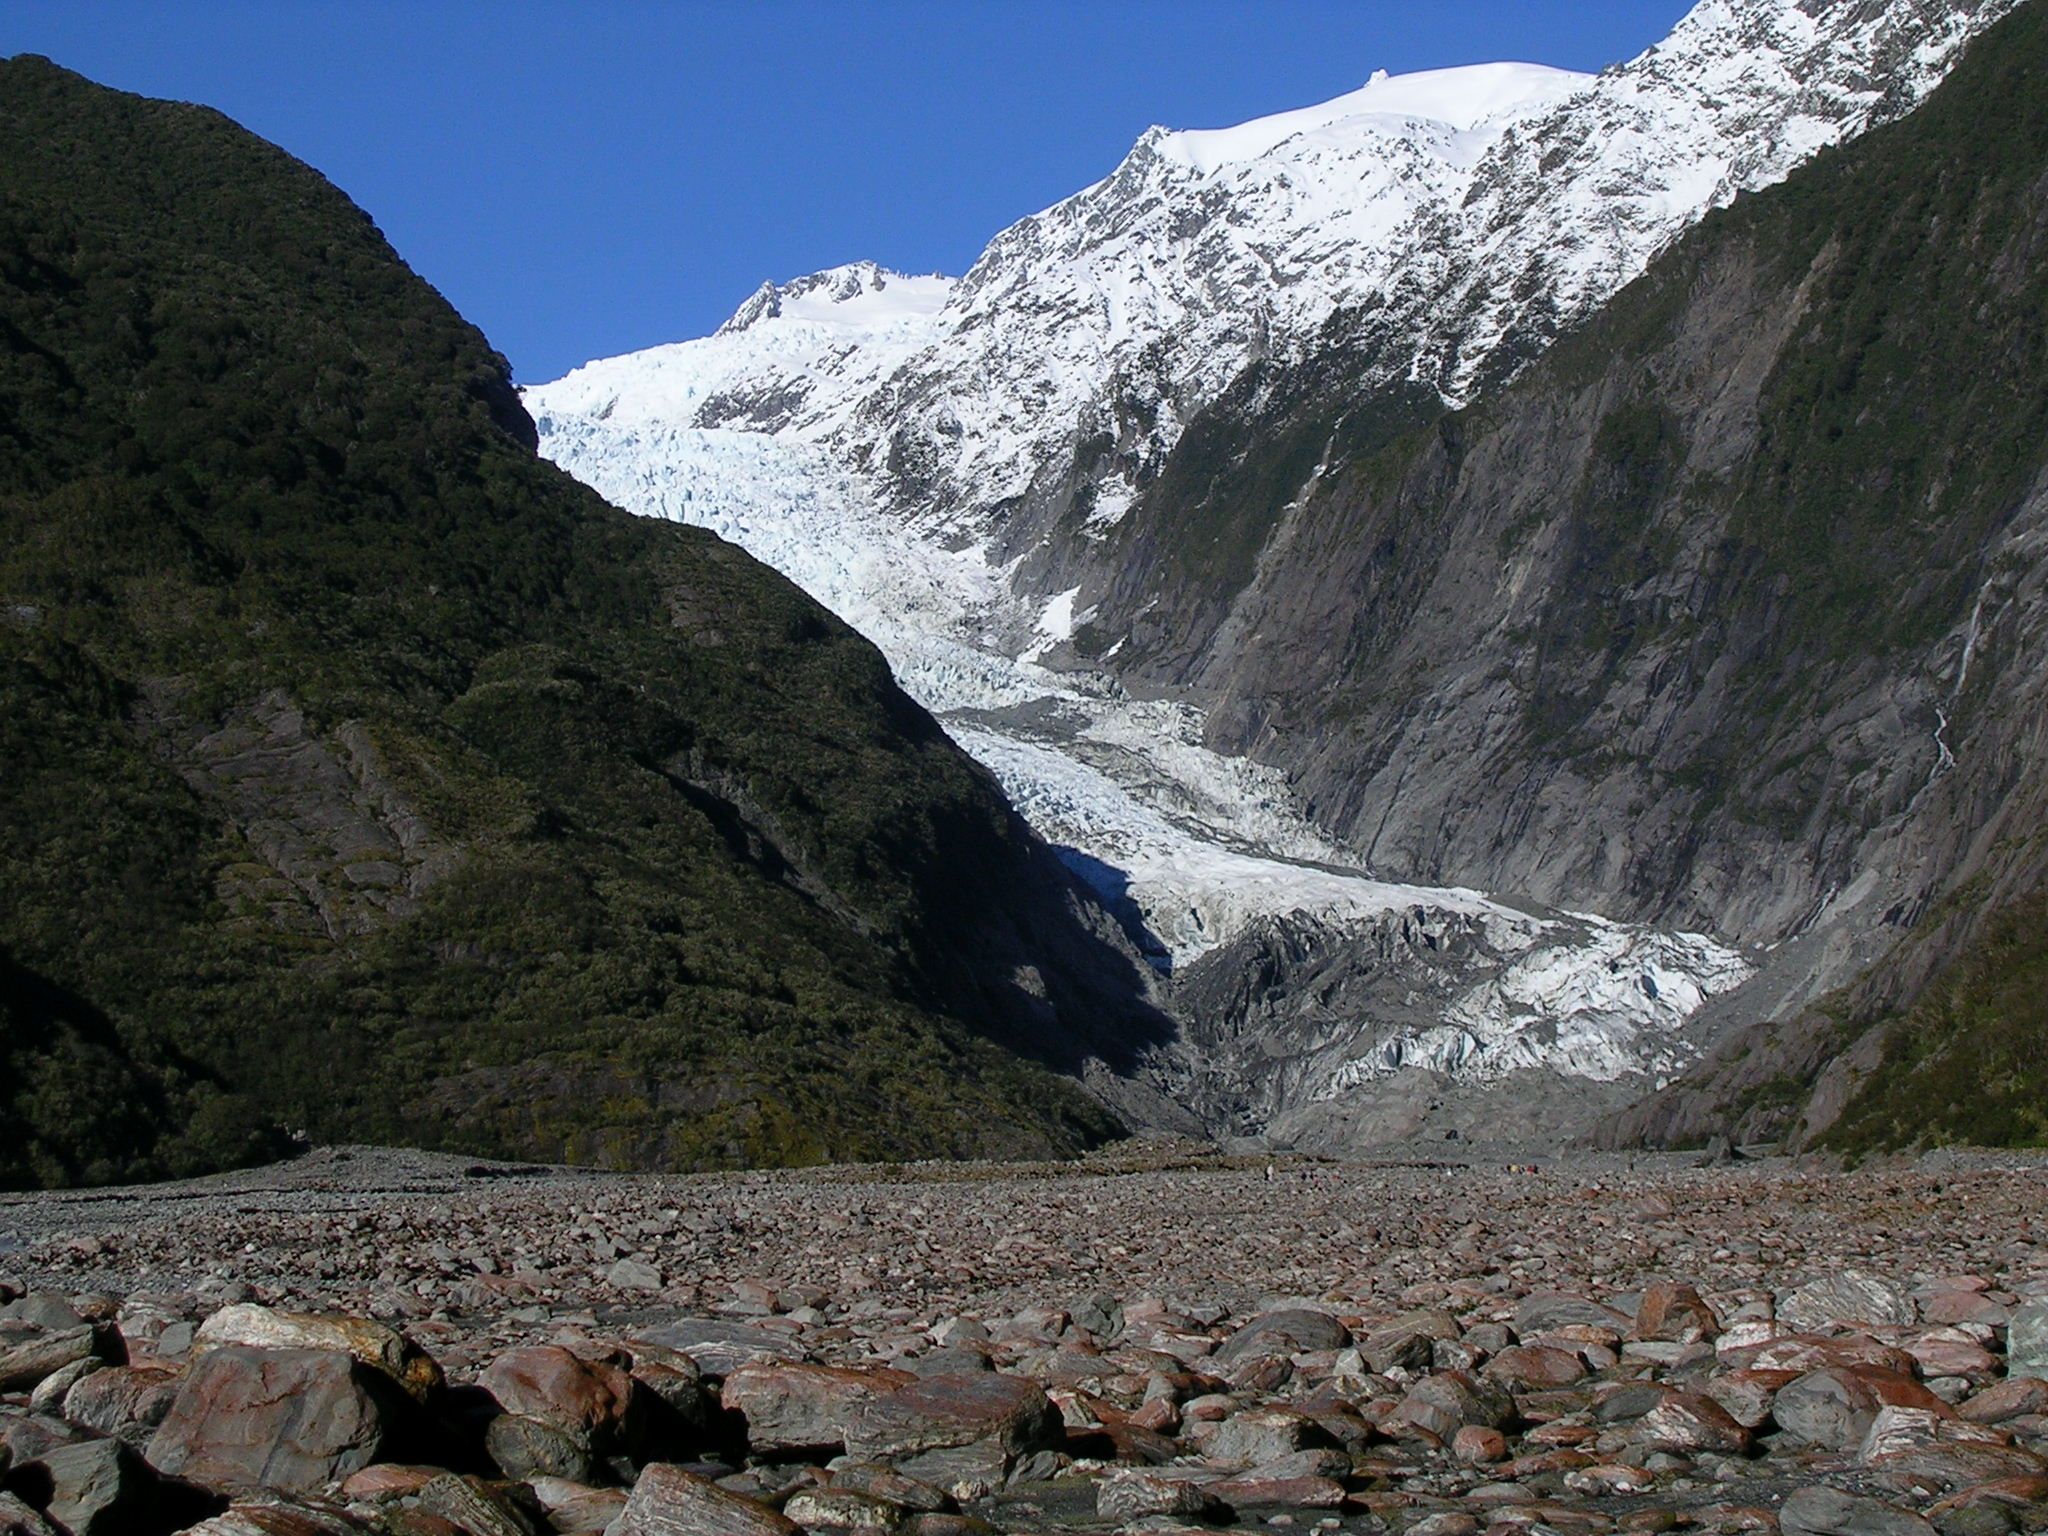
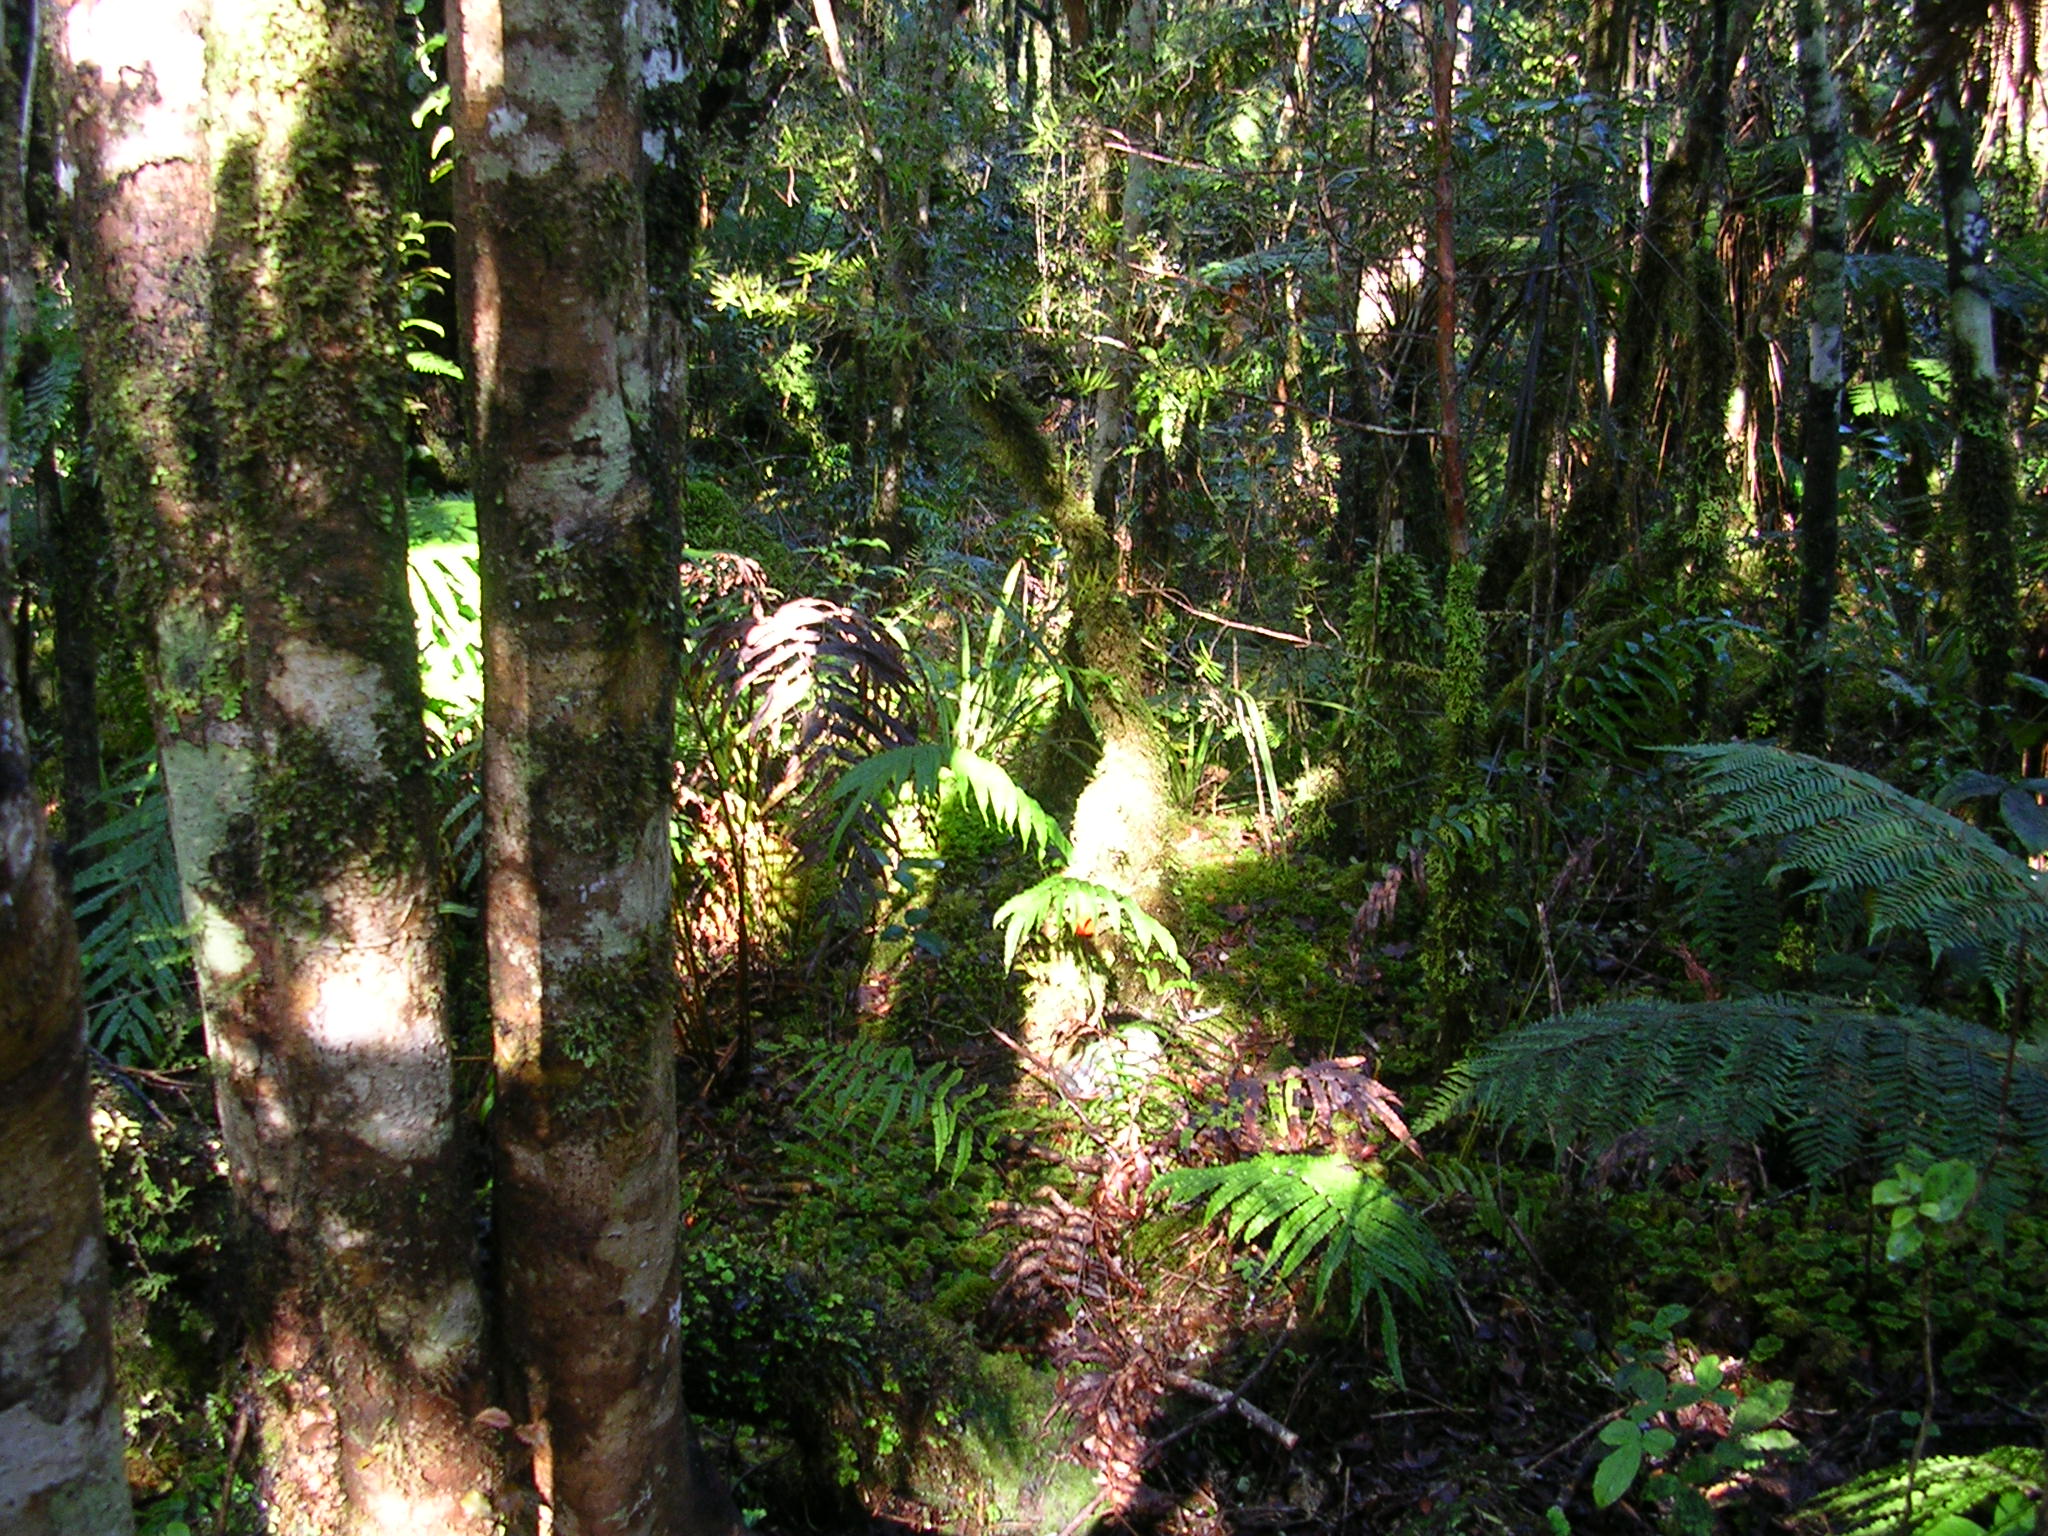
A good question. Levels of both N and P are very low in very young ecosystems (which typically have rocky soils; see picture above), higher in intermediate-aged ecosystems (see picture), and often lower in old ecosystems. How N levels change relative to P, though, is a trickier subject. The best-studied sites show relatively low N in younger ecosystems and relatively high N in older ecosystems, but there are some places that show opposing trends.
Prior to your research, how did theoretical models assess the impact of these two nutrients on ecosystem dynamics?
Prior to our work there were a series of conceptual developments, which I will call “the classic model,” but there was no previous mathematical model of N and P dynamics during long-term ecosystem development. The classic model states that ecosystems should progress from N deficiency in younger ecosystems to P deficiency in older ecosystems, as is seen on the best-studied sites. According to the classic model, this happens because of the differences in where N and P come from. P is present in most rocks, whereas N is not, so P inputs are largely controlled by the weathering of rocks. Consequently, very young ecosystems have large P inputs, whereas very old ecosystems have small P inputs. On the other hand, N comes primarily from rain, so N inputs don’t necessarily depend on ecosystem age.
 Your paper mentions that these models don’t account for several possible trajectories of ecosystem evolution. What was missing?
There are a number of missing elements that jumped out as potentially important. First, the input side of the story isn’t as simple as “P comes from rocks, N comes from rain.” P also comes from dust that is blown in from upwind, whereas N can also come from organisms like soybean or alder that “fix” N from the air. Second, N and P losses from ecosystems should be as important as inputs in determining N and P levels, but these weren’t the focus of the classic model. These facts have been known for a long time in the scientific community, but no one had looked at what their implications might be for ecosystem development.
What was your new model and how did it cover these aspects?
Our model is novel for a couple of reasons. First, we considered a broader set of N and P input and loss dynamics than the classic model, which made for a richer set of possible ecosystem trajectories. Second, the type of mathematical analysis we did was unlike anything previous researchers had done in this particular field, and made it possible to pin down the types of conditions that might lead to different soil conditions.
What were some of the key data accounted for in your model that were overlooked in previous analyses?
Aside from the input and loss dynamics mentioned above, one piece of data we keyed in on was that microbes in the soil have an easier time accessing P than N in dead plant material. Again, this “preferential P mineralization” is something that has been known for a long time, but we thought that the effects of this quirk might not be fully appreciated.
What were the main findings of your analyses?
In addition to the classic “N limitation to P limitation” path, our model shows that many other trajectories are feasible. For example, if dust deposition is high and N-fixing organisms are abundant in young ecosystems (as they often are), an ecosystem might start out P limited and end N limited. One of the more surprising findings was that the levels of N and P in soil organic matter (mostly dead plant material) don’t necessarily correspond to N versus P limitation in an intuitive way.
What are some of the practical applications of this model- for example, for developmental activities in rainforests, or human activities planned in other ecosystems?
Whether N or P has a greater effect in an ecosystem has important implications for many environmental issues. The most important application is enhancing our climate models. Excess N can be transformed into a greenhouse gas, whereas P cannot. So, a better understanding of nutrient levels will improve predictions about the extent of climate change.
Congratulations to the authors on receiving an ESA award for this outstanding research paper!
Citation: Menge DNL, Hedin LO, Pacala SW (2012) Nitrogen and Phosphorus Limitation over Long-Term Ecosystem Development in Terrestrial Ecosystems. PLoS ONE 7(8): e42045. doi:10.1371/journal.pone.0042045
Photos by Duncan Menge:
top: the rocky soil of a very young ecosystem, Franz Josef glacier in New Zealand. The rainforests in the valley formed by the Franz Josef glacier are some of the best studied ecosystem development sites in the world.
below: a rainforest on 500 year old soil near the Franz Josef glacier.