The Power of Zombie Statistics: Systematic Review Edition


It sucks you in before you can even think – that dramatic statistic that makes a point you’re inclined to believe, with a bang. After that, no matter how many times it’s shot down, it just keeps going… And so you have it: a zombie statistic.
Zombie statistics, wrote Deborah Mesce,
are repeated often enough that they have attained the status of official fact. They are referred to as “zombie statistics” because, though they have no basis in fact, they just won’t die. Numbers like these make good headlines and rally advocates for various causes. But if you’re trying to solve a problem, you have to know what the problem is, and zombies just muddy the waters.
I think their attraction and power comes in part from confirmation bias: often, even if the statistic is a revelation when we first encounter it – either as the person who generated it or as a reader – we were at some level pre-disposed to believe it. So we just don’t subject its basis to the type of scrutiny we would apply to something we adamantly did not want to be true.
That we have lots of zombie statistics lurching around us isn’t surprising once you start to think about it. When I started looking at search results for zombie statistics, I was surprised by how many of them I’ve heard and accepted without thinking about it. Well, you can’t investigate every little thing you ever hear, can you? I do scrutinize the ones I include in what I write. But in general life, you just have to trust that people who propagate claims with numbers and proportions on them have done their homework.
The trouble is, the temptation to use statistics for advocacy can be irresistible – even, it turns out, to scientists advocating for better, more reliable science. I’ve been irritated by a couple of these undead numbers lumbering around my field of vision this month, both of which I’ve taken shots at in the past. Two cases are definitely no zombie apocalypse, that’s for sure! Still, I believe swatting at them matters, even if it is futile. I always get “stop the friendly fire!” protests when I do it. To me, that only shows how pernicious this is. And since I’m not the only one who doesn’t want to propagate zombie statistics, here we go again…
Today I’m swatting at John Ioannidis’ only 3% of systematic reviews are “decent and clinically useful” zombie. Clearly something like this is extraordinarily speculative, but that won’t stop its use discrediting the usefulness of systematic reviews in health. The provenance: a paper he published in 2016, and which we debated one aspect of at PubMed Commons at the time (archived here).
The little green sliver at the top is the 3% – it’s just what’s left from 100% after five statistics swallow up the rest. Let’s go round those big slices clockwise.
Steel blue: 20% of systematic reviews are unpublished. There was no data basis. As Ioannidis stresses in the text, “The number of unpublished meta-analyses is unknown”. The 20% was an extrapolation based on some of the studies estimating unpublished clinical trials finding rates over 30% (not a systematic assessment of all such studies): “Therefore, a minimum 20% nonpublication rate for produced meta-analyses may be speculated”, he wrote.
Orange: 27% are “redundant and unnecessary”. In the text, this is “probably another 1 in 3 are redundant, unnecessary meta-analyses of other research types”. There is discussion of some studies of multiple systematic reviews, of the cherry-picking kind. At the basis of the argument are some data and conceptual flaws I’ll come back to.
Gray: 17% are “decent, but not useful”. If you can figure out where the 17% estimate comes from, please let me know, because I can’t. What he means by “not useful” seems clear, though: “uninformative” because of no, or weak, evidence. To me, this is like saying a so-called negative clinical trial is uninformative. Knowing when there is no good evidence is absolutely fundamental to decision-making.
If you have to choose between options and there is no good evidence to push in one direction or the other, then you know it’s now totally a matter of personal preference, convenience, or cost. And boy, is that good to know. Remember that some of those options will come with enormous pressure to use them by advocates despite the lack of good science in their favor.
Yellow: 13% are “misleading, abandoned genetics”. I don’t think they would belong in a pie trying to decide what proportion of systematic reviews are clinically useful. On the other hand, I think the issue of commercially conflicted systematic reviews which Ioannidis also discussed deserved a specific slice of the pie.
Dark blue: 20% are “flawed beyond repair”. I personally think that’s kind of generous: a more systematic assessment could help get a clearer perspective on this.
And that leaves our 3% “decent and clinically useful” zombie statistic. It’s oddly specific, isn’t it? That communicates spurious precision and should really set people’s BS detectors off. Yet, the thing about statistics is, they can do the opposite, can’t they?
There were data and conceptual flaws at the heart of the whole exercise of determining what were redundant systematic reviews in this paper, which is what we debated at the time these numbers came into the world. The data flaw entered the picture because Ioannidis’ calculation of how many systematic reviews there are versus trials was crippled by misperceptions of how PubMed indexes these studies. So he compared numbers of systematic reviews that over-estimated them by including a big proportion of non-systematic reviews, with a way of calculating trials that under-estimated them. He concluded that there could be more systematic reviews than clinical trials, and I think that is dramatically off base. But it gets accepted uncritically, and staggers on: see this 2019 opinion, for example.
Back in 2010, a group of us grappled with estimating the rise of trials and systematic reviews. This month, I grappled with updating that data. Generally, we have 2 kinds of data: one kind that under-estimates the numbers, and another that over-estimates it. I believe our best option is to chart them both, and view the reality as falling somewhere in between.
Here’s what I think is happening with trials:
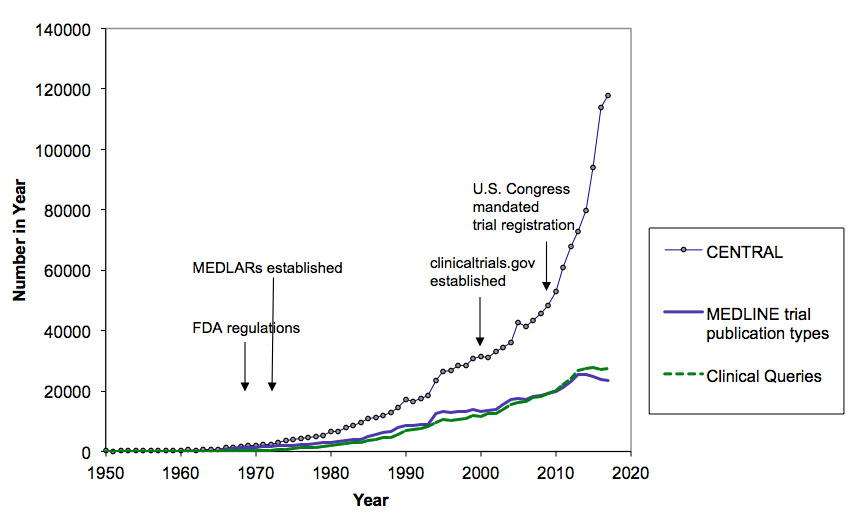
The super-steep one is from Cochrane’s CENTRAL registry of trials. That is including trials that are in registries, so there is a proportion that aren’t in the literature. There will be non-trials and duplicates in there, and trials that aren’t finished, too, but I don’t know the proportion. The lower data series are the under-estimates. They will be particularly under-estimated in recent years, because the human indexing they rely on takes time. Here’s what I think the trends in the context of a variety of types of research look like:
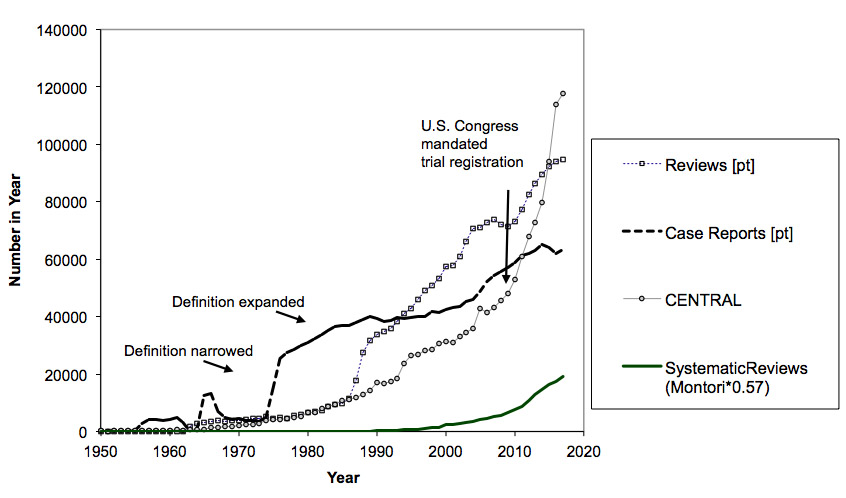
The trials-to-systematic reviews ratio is problematic here, because the trials are from CENTRAL, and everything else is from PubMed. It’s a difficult situation. Trials increasingly report results in those registries – that’s a mandate for a lot of trials in the U.S. That makes considering only trials published in journals increasingly problematic to gain perspective on what’s going on. The rate of systematic reviews does seem to gaining pace against trials – but they are still not close in magnitude, unless someone can prove the existence of around a million unpublished systematic reviews since 2000 or that many duplicate records in CENTRAL.
The second flaw in Ioannidis’ paper was a conceptual one. It came from not considering the magnitude of reviews that are not redundant because they are updates, or done at time points that make them de facto updates. A trial report is forever: a systematic review is ephemeral, and except for the unusual case when a case is truly closed, it needs to be done again. That’s not to say there isn’t a lot of waste and redundancy. But you can’t begin to grapple reasonably with that concept without taking into account systematic reviews’ on average 5-to-6 year use-by date.
The second zombie statistic that bugged me this month lurched across the screen at a (very wonderful) meta-research and open science conference I participated in (AIMOS 2019). It was the hyped-up claim about the effects of badges for data sharing that I’ve taken swipes* at. Sigh!
Once a number proves to be ideally suited to an advocacy position, regardless of how often debunking should shatter it, it can march on, undead. It raises uncomfortable questions about why this happens, even when the cause is trying to improve science practice. Cheryl Doss writes:
Using unsubstantiated data for advocacy is counterproductive. Advocates lose credibility by making claims that are inaccurate and slow down progress towards achieving their goals because without credible data, they also can’t measure changes.
When you are being led astray by an illusion of sound data, you can never be sure you are on the right path, can you? Just because a dramatic zombie statistic draws attention in a good cause, doesn’t excuse its falseness.
~~~~

* My posts on the open badges zombie statistic (updating evidence on this is on my to do list):
What’s Open, What’s Data? What’s Proof, What’s Spin?

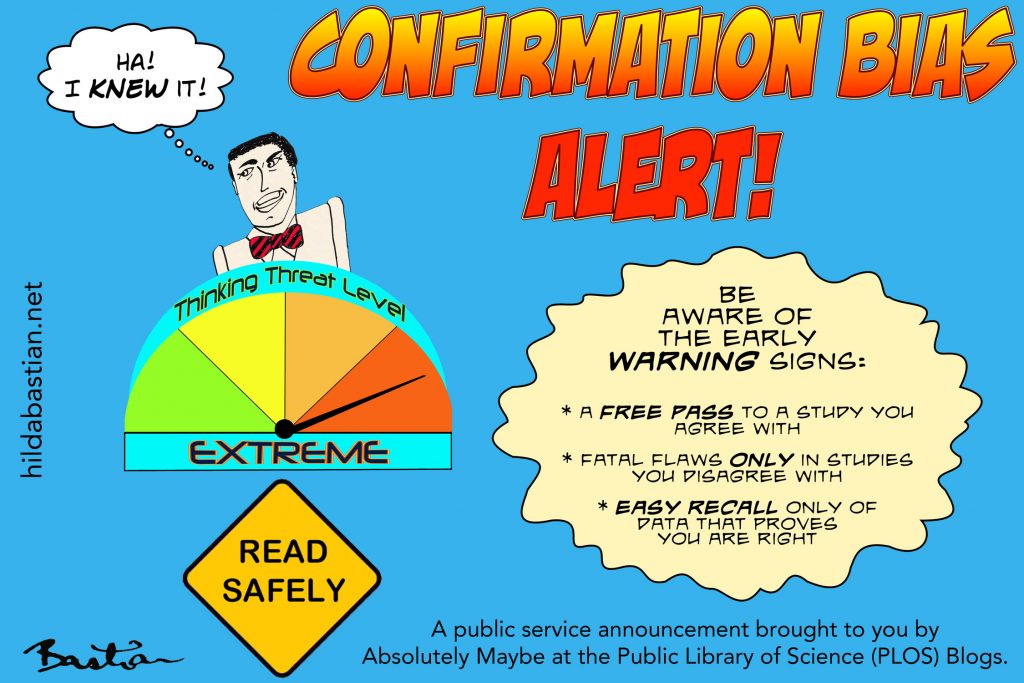
And this post discusses what we know about resisting confirmation bias and its cousins. More on confirmation bias and evidence assessment at The Catalog of Bias.
Open data along with explanation of data sources for the analyses of the number of trials and systematic reviews online here.
The cartoons are my own (CC BY-NC-ND license). (More cartoons at Statistically Funny and on Tumblr.)
Is there maybe a third flaw, which you hint at early on, if the % of good reviews is 100 minus the total of the other categories? Isn’t it possible (indeed, likely) that a “redundant and unnecessary” study is also based on “abandoned and misleading genetics”, for example? Or did the methodology involve going round each reason in turn?
Oh yes, it sure does. And a redundant and unnecessary review could also be flawed beyond repair. The whole thing doesn’t add up.
Thank you very much for this post. The derivation you criticize represents a pattern of highly speculative numbers compounded into zombie statistics quoted from Ioannidis’s writings, going back at least to his 2005 PLOS Med article; e.g., see Goodman & Greenland’s comment of which PLOS would only publish a brief redaction, and Jager & Leek’s analysis (which has 6 comments and a rejoinder following it).
As Nick pointed out, even if one accepted Ioannidis’s estimates for the categories (which we don’t), we did not see where he accounted for category overlap was correctly accounted for in the final estimate, and over all the categories that overlap could be extensive. Failure to account for overlap would thus be another factor driving the already wildly-speculative estimate down so low.