Medical assistance and crisis mapping: is the hype justified?
Guest post by Sierra Williams
Popular data visualization tools and crisis mapping software are increasingly relied upon to better equip on-the-ground medical assistance in disaster emergencies. While there is certainly nothing new about using data analysis for monitoring and addressing such crises, the influence of online data analysis platforms in the last year has been striking. Following Japan’s seismic earthquake and tsunami in 2011, crisis mapping websites, particularly Sinsai.info, created using the open source software Ushahidi, came of age as a real time strategy to effectively mobilize resources and provide rapid-response information for disaster relief and humanitarian aid workers.

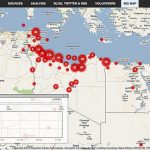
Crowdsourced data platforms like this — that aggregate location-specific water, shelter, and food needs via social media outlets, which are then plotted on a visual map — have been used in Haiti, Egypt, Libya and elsewhere to help medical relief and human rights workers make sense of changing situations and respond accordingly. While there are various approaches on how best to utilize these technologies (see IRIN News on the subject), it goes without saying that open access of these data streams is instrumental to its increasing effectiveness (for more on this, see Tim Berners-Lee TEDTalk).
Development Seed, one of the leading data visualization and mapping organizations has recently launched a Horn of Africa project. In a region dealing with widespread famine threatening the lives of millions of people and displacing even more, the current situation is nothing short of a global tradgedy.[1] The goal of Development Seed’s technology is to communicate a regional lens with ongoing operational aid strategies occuring throughout the wider provinces. But will this real-time pictographic representation contribute to increasing aid’s effectivity and reducing the catastrophic number of deaths and suffering? While up-to-date information on the region might provide an encouraging participatory model of aid transparency, it is equally apparent that there are other more intransigent, systemic issues at play in war-torn Somalia which a repository map of crowdsourced data may fail to accurately portray. In September twenty international aid organizations wrote an open letter to the international community asking them to re-assess current strategies in Somalia and to instead emphasize how to “enhance diplomatic engagement with the parties to the conflict, to ensure the unhindered delivery of humanitarian aid”. It is unclear as of yet if or how crowdsourced technologies can actually positively influence this necessity.
NPR’s social media strategist Andy Carvin suggests that problems with conflict mapping were first really recognised with the uprising in Libya saying, “When you post information on a humanitarian map, the worst it could be is just wrong and maybe waste a person’s time. But if you put the wrong information on the war-related map, you could be putting people’s lives at risk. And [Libya] is one of the first times that I’m aware of where we’ve been able to see these social mapping projects happen at the same time, and get a sense of how the dynamics are different.” Lessons must be learned in order for crisis mapping to responsibly contribute and recognize these variable conditions. As the international president of Médecins Sans Frontières (MSF), Dr. Unni Karunakara said in a stern indictment against aid organisations and the media for their myopic portrayal of the humanitiarian crisis in Somalia, “Against the backdrop of conflict, where many agendas are at play, it is difficult for a medical humanitarian organisation like MSF to expand health services and have an impact.”
Clearly the technological advancements of data visualization and crisis mapping become increasingly complex, even problematic, in situations compounded by violent, political conflict. Throughout the wider international humanitarian community, from aid organisations to computational technologists, there must be a greater awareness of how data is used, interpreted, and responded to and whether or not this information directly contributes to the security and well-being of the most vulnerable.
Just as aid alone will not solve the crisis in the Horn of Africa, open crowdsourced data alone will equally prove insufficient. Open data has proven itself to be the way forward for addressing such humanitarian crises, and it is even further incumbent on those (predominantly in the West) that have the skills and resources to help facilitate wider access to these tools, but we must figure out how to incorporate into the crisis mapping framework the way that the wider conditions of war might stymie humanitarian aid and medical assistance.
Sierra Williams is an Admin Assistant at PLoS.
[1] Amnesty International
labels it a “human rights catastrophe”. A recent policy brief from the ONE Campaign estimates “13.3 million people are in crisis…and at least 30,000 children have died in the past 3 months, with UNICEF estimating that one child dies every six minutes in Somalia. The UN warned on September 5 that up to 750,000 people could die in Somalia in the coming months.”

Thank you for this brief critique, it’s so rare to hear anything by hype about such technologies.
S