Pause for thought
Ed Hawkins, Doug McNeall and I have just had a commentary published called Pause for Thought. It’s part of a Nature Focus on the slowdown in global surface warming, which includes six commentaries plus new research by Seneviratne et al. on how the number of extreme hot days has continued increasing throughout the slowdown in the global average. Unfortunately it’s not open access, but the content is free for the next month with registration, and I can also put our article online in six months.
First, what is the slowdown? Since the late 1990s the global average surface temperature has increased more slowly than in the two decades before. In fact it is fairly flat, so it’s often called a pause or hiatus, though there is increasing evidence that it’s a slowdown not a complete stop.
Our piece is not about whether it is a pause or slowdown, or the various reasons this may have happened (one of them being a temporary increase in heat being transferred from the atmosphere to oceans). We write about communication of this topic, particularly online. It’s also the first Nature paper where the authors give their Twitter handles!
Climate model projections have shown periods of cooling of about this length, embedded within longer-term warming, since before this pause happened. But our communication of this expectation has not been good: it has been a surprise to public and journalists alike.
First, the IPCC Summaries for Policymakers have not been very clear that pauses could occur, at least until the most recent report (quotes from these are given in the article).
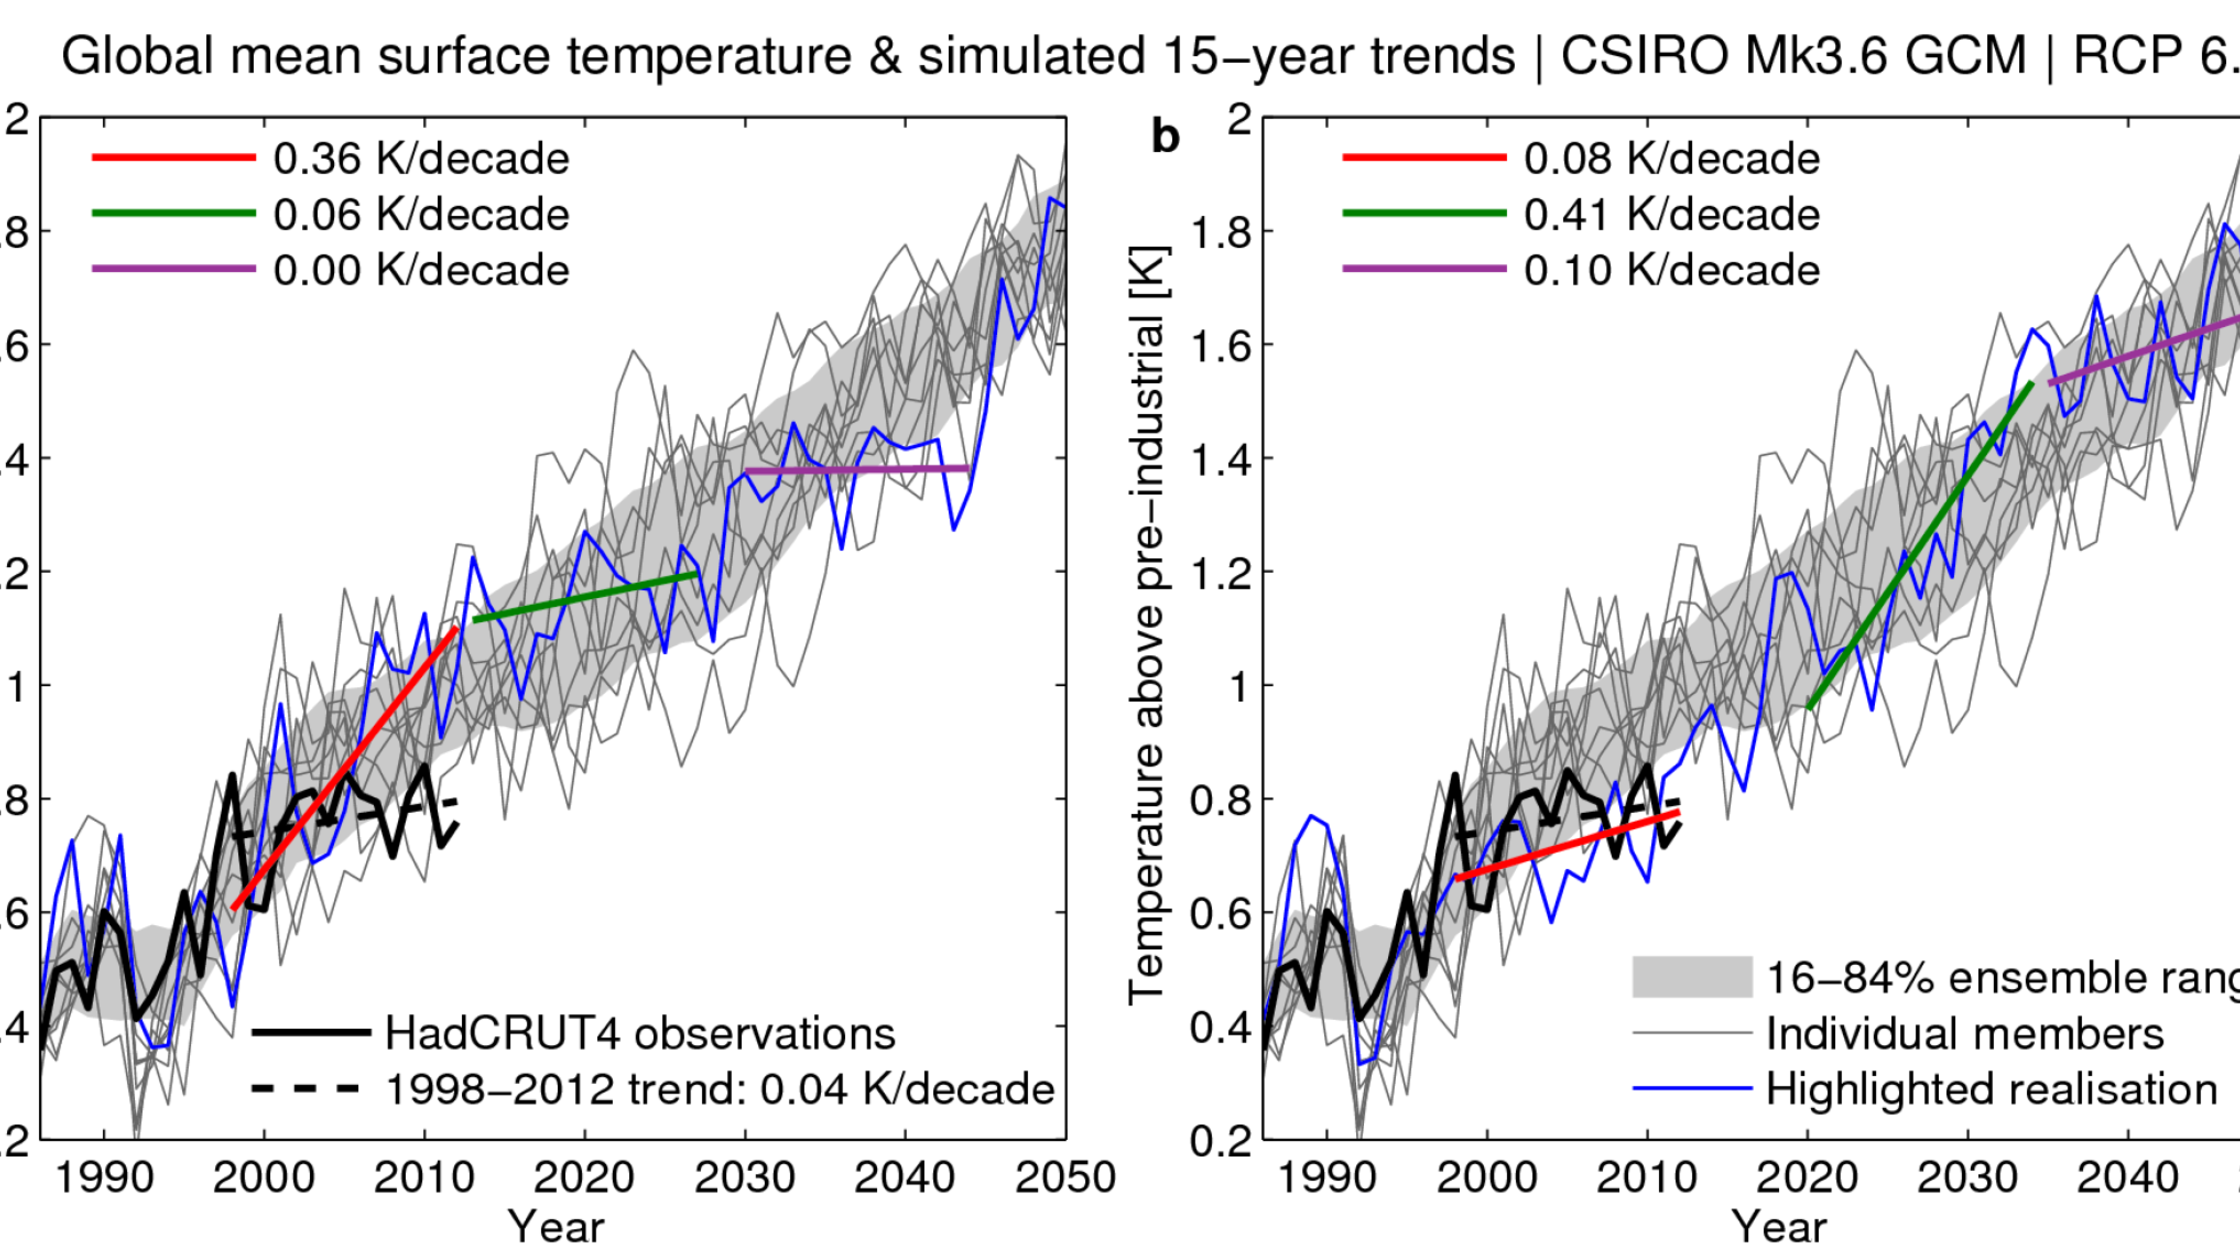
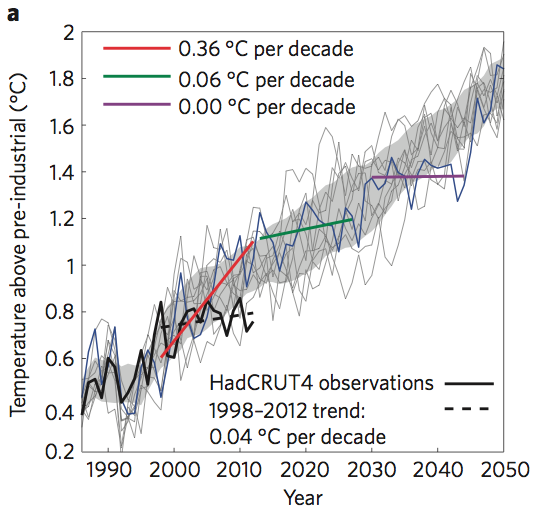
Second, climate scientists tend to show averages of many simulations, which smooths out any temporary changes in trend. Here is a figure that shows some individual simulations and how each one can have slowdowns at different times:
Although the most recent decade is the warmest since 1850, this does not mean there is no pause, as some have seemed to suggest.
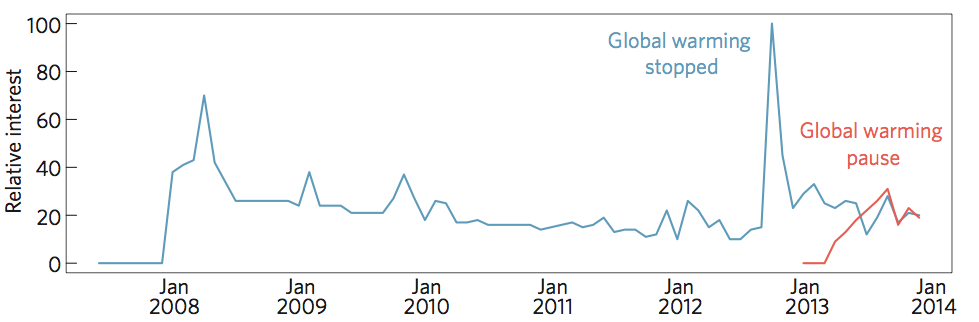
As a rough guide to public interest in recent years, we included a Google Trends graph for related searches:
We point out the very active discussions in the Twittersphere and blogosphere, “often discussing rather complex technical issues from the latest literature”, but note that the amount of content from climate scientists is hugely outweighed by that from commentators (on any point of the opinion spectrum).
So we call on our fellow scientists to join us in these online conversations. I talked in a recent Open University panel on social media and climate science — recording here — about “flooding the market” (no pun intended) with climate scientists. This shares the ‘load’ for us all, by involving more experts from different research areas, and shows climate science and scientists most directly. We give some general recommendations about engaging with the public online:
Although online conversations can be unpredictable, rambunctious and frustrating, they are often personally and professionally rewarding…From our experience, the online ‘audience’ is often technically proficient, but neither captive nor necessarily interested or patient, so conversations are more successful than lessons. We always expect, and try, to learn something from those we seek to ‘teach’. Where there is a genuine uncertainty we must not ignore it. We find that being defensive, over-confident or dogmatic are not successful strategies. Humour and humility are useful in keeping people on board and one’s sanity intact.
We believe the complexity of the science and the public interest in the pause are not ‘difficulties’ to be avoided or glossed over but instead provide a fantastic opportunity to dig into the details of the science.
We should see the pause as an opportunity, offering a clear hook to explore exciting aspects of climate science; to draw back the curtain on active scientific discussions that are often invisible to the public. The pause is a grand ‘whodunnit’ at the edge of our scientific understanding…The challenge is to embrace the complexity of the situation, to acknowledge the uncertainty and the nuance, to welcome questions and investigation and show the process of climate science in good health. Online engagement would seem to be essential in this endeavour.
[Note on moderation policy: all comments are moderated by me, not PLOS. If there is a delay in viewing your comment it’s because I haven’t read it yet. If someone else’s comment appears it’s probably because they have commented before under that email address and are automatically allowed through. Too many links might also send you into a spam folder that I never check.]
People seem to have difficulty reading more than the headlines of articles, and these are usually designed to grab attention rather than inform.
The difference between a pause and a stop unlikely to be very clear to the general public under these circumstances
“Climate model projections have shown periods of cooling of about this length, embedded within longer-term warming, since before this pause happened. But our communication of this expectation has not been good: it has been a surprise to public and journalists alike.
First, the IPCC Summaries for Policymakers have not been very clear that pauses could occur, at least until the most recent report (quotes from these are given in the article).”
Does this mean that the compilers of the IPCC Summaries WERE aware of was was to be an impending ‘pause’, and (deliberately) failed to advise of it? Or, it came as a surprise to them too, in which case the sentence should more-accurately be “… it has been a surprise to renowned climate scientists worldwide, public and journalists alike.”?
What is it you want to communicate, Tamsin? That there has been a pause? Everyone already knows that.
Or, is it that the models can show pauses, and because they can, then that shows that models can effectively simulate the real world? Maybe. And maybe not, at least in their current forms, which seem to exhibit wide divergences and are almost exclusively higher than empirical observations.
Or, that climate science orthodoxy is correct, that anthropogenic CO2 is a major contributor to global warming since 1850, especially in the latter half of the C20th, and that we’d all better believe the results of that will be dangerous? Which I’m currently very sceptical about?
It just occurs to me that you need to encapsulate what it is that you want to communicate, and why you want to communicate it. That would be something it might be useful for me to know and might help me determine whether or not your message is actually worth communicating, or really, an attempt to recover some credibility for the scientific community on the issue of AGW just by sounding more affable: as if somehow that countered the many examples of the contempt in which it has held sceptics in the past? As if it would somehow regain lost trust?
IMO, Judith Curry speaks most sense on the global warming issue. She has gained my trust by being quite open about the many uncertainties in climate science, and being unafraid to call out nonsense where she sees it. This predisposes me to listen to her when she supports some evidence I might otherwise have cause to question.
She has an advantage over you: she’s long-established and secure enough to speak her mind. I think she’s already gone where you should be going, but I do wonder whether you can afford to go there if you want a secure future in your profession. My sense is that she’s been approving about you on her blog, by the way: so maybe your heart’s in the right place, but you have a mountain to climb when it comes to thoroughly disenchanted sceptics like me.
You ever heard of Occam’s Razor? Oh wait, silly me, 95% of climate models agree: the observations must be wrong.
Cross-posted from BH:
In GCM output, the individual years are not valid prediction points, it is the overall long-term trend and the level (of temperature anomaly) reached that are.
If the individual year points were valid predictions, it must be because they emerge owing to underlying deterministic mechanisms operating at the annual level. Consequently, multi-year stretches should show reproducible patterns across models. Then multidecadal pauses, peaks and troughs would be reinforced across models when you average their output.
What is seen, instead, is the opposite. The annual and multi-decadal variability across models cancel one another across models and you get a smooth line. It is not the averaging that produces the ‘smooth temporary trends’. The models do not carry valid information at short time-scales which is why their averaging produces a null.
Consider, readings obtained by radiosonde and satellite MSU – data obtained by two different methods of measuring temperatures. When you average them, are the annual and multi-decadal trends preserved, or do they cancel each other? Trends are preserved. Consider models, on the other hand – average a handful of them and the result is a smooth, straight line. If the average of ‘x’ processes showing variability (waviness) at timescale ‘t’ is a smooth line, the variability shown by the processes is fake (i.e., not real).
The figure 1a graph and conclusions reached from such analysis are both wrong.
I agree that pause for thought is appropriate, but probably not in the way you intended. It is time for the majority of climate scientists to open their minds and their eyes and consider that CAGW is based on a number of scientific assumptions and a period of warming 1975-1998.
Add to temperature hiatus the missing energy, missing hot spot, lack of increase in humidity and failure of the models and any objective scientist would begin to question the whole thing.
The latest (5th) Assessment Report of the International Panel on Climate Change has halved their previous estimate of the rate of global warming since 1960 from 0.2C to 0.1C per decade. In fact there has been no temperature rise since 1998, and there is currently a divide within the climate science community between those who rely on computer models and those who continue to study the empirical data in terms of their future projections of global temperature. The later predict another century like the last with a 1C rise in temperature, while the former rely on computer models to produce temperatures of 3-6C higher, via an acceleration of global temperature rise that has not been seen since a brief period in the late 1970s. The empiricists’ predictions of a cessation of warming followed by a plateau or fall starting about 2000 and lasting anywhere up to 30 years have been fully borne out by the data. If the empiricists’ predictions continue to be borne out, then within a decade there will be a widespread agreement that whatever the merits of the models themselves they will have proven fundamentally incapable of predicting future climates on the scale of decades as a guide to devising the wise human response.
MJK
Tamsin
The problem is not the Pause but more that temperature anomalies as presented are incorrect and basically a result of statistical fiction.
If we are going to talk about science then maybe we should present the data properly. Temperature measurements are going to have an accuracy of roughly +/- 0.5 degrees at best. This is systematic error inherent to each measuring site. An anomaly would have an error of 0.7 degrees. That’s just based on engineering judgement. It’s probably more due to microsite issues. No amount of repeated measurements is going to reduce that error at least over the sensors lifetime. You can’t assume CLT.
No amount of statistics is going to eliminate this. To get better accuracy use a more accurate measuring device and characterise the environment.
However, the only reason we are looking at anomalies is because AGW theory predicts changes of 0.2 degrees per decade. Hence we create a data set to match this not realising it is based on multiple assumptions. It’s a self fulfilling prophesy.
Assumptions that by the way are not explicitly stated every time the graphs are published. Which is what you must to be scientific. You shouldn’t be hiding behind graphs.
And since models are fitted to this anomaly that’s meaningless as well in the real world. In reality the worst model is going to fit when error bars cover temperature changes of 1 degree or more.
The Pause is not a real thing in the real world. Simply because we cannot measure to the accuracy stated. Much the same as every other climate variable.
More time should be spent in a lab characterising CO2 and getting definitive forcing relationships, understanding the fundamental physics rather than giving it lip service.
What has happened is that science has been hijacked by theorists who are trying to use computer models to somehow circumvent taking measurements and doing experiments.
Climate scientists were aware a pause like thiscould happen (because there are natural cycles on all timescales), but couldn’t predict exactly when it would happen (this is much harder because of chaos).
In the main body of the IPCC reports you can find lots of statements about natural variability, about decadal length fluctuations. Where we failed is that we didn’t express this clearly in the Summary for Policymaker of each report.
For example, AR2 (1995): “Any human-induced effect on climate will be superimposed on the background ‘noise’ of natural climate variability.”
The meaning of this is “Shorter term changes in trend will occur, so we might see slowdowns, pauses or cooling that temporarily mask the human-caused warming”. But as you can see it’s rather obscured…
It’s always good to know what you want to say!
I suppose we tried to cover a few points:
Before the pause:
a) whether scientists had predicted that slowdowns could occur (yes)
b) whether we had made this clear to others (no)
During the pause:
c) whether scientists were talking about the pause online and in the media (not as much as we would ideally be)
d) whether the pause, our understanding of it, and its implications for human-caused warming were being correctly explained (not always)
And what we called for is more scientists to communicateanything about the pause…as long as it’s right.
Not at all, we’re saying they’re both right 🙂
Or more accurately, the models have not yet been shown to be inconsistent with the observations.
I guess there is a difference between being aware that such a pause *could* happen and being able to forecast *when* it would happen. I doubt any climate scientist was aware of an ‘impending’ pause but they should have communicated that a pause of this length was possible.
e) whether climate scientists’ refusal, until very recently, to even admit the idea of a “pause”, makes them less credible when they now say “this is consistent with our models” (yes)
Given the vast majority of online content is not by climate scientists, I think it may have been a discomfort that lay with commentators and those outside the field. Actual climate scientists discuss this stuff comfortably in the literature and in conferences. Maybe you have specific examples in mind?
I was more critical of poor communication of the pause — giving examples — in an earlier draft. My more tactful co-authors, and the word count, reined me in!
Tamsin in your mind is there any test or criteria that could invalidate current climate models? For instance if the pause continues another 5 years or 10 years should the models still be trusted as the basis for future projections and policy decisions?
The Met Office were STRONGLY predicting publically, and to governemnt, with no mention of possibilities of any pauses..
an example..
http://web.archive.org/web/20080708230357/http://www.metoffice.gov.uk/corporate/pressoffice/2007/pr20070810.html
News release
10 August 2007
The forecast for 2014…
Climate scientists at the Met Office Hadley Centre will unveil the first decadal climate prediction model in a paper published on 10 August 2007 in the journal Science. The paper includes the Met Office’s prediction for annual global temperature to 2014.
Over the 10-year period as a whole, climate continues to warm and 2014 is likely to be 0.3 °C warmer than 2004. At least half of the years after 2009 are predicted to exceed the warmest year currently on record
These predictions are very relevant to businesses and policy-makers who will be able to respond to short-term climate change when making decisions today. The next decade is within many people’s understanding and brings home the reality of a changing climate.
The new model incorporates the effects of sea surface temperatures as well as other factors such as man-made emissions of greenhouse gases, projected changes in the sun’s output and the effects of previous volcanic eruptions — the first time internal and external variability have both been predicted.
Team leader, Dr Doug Smith said: “Occurrences of El Nino, for example, have a significant effect on shorter-term predictions. By including such internal variability, we have shown a substantial improvement in predictions of surface temperature.” Dr Smith continues: “Observed relative cooling in the Southern Ocean and tropical Pacific over the last couple of years was correctly predicted by the new system, giving us greater confidence in the model’s performance”.
Notes
Total global warming, on a decadal average, is 0.8 °C since 1900 (IPCC 2007)
1998 is the current warmest year on record with a global mean temperature of 14.54 °C
see also – strong predictions (no pause, or possibility of a pause, spoken about)
Met Office – Vicky Pope strongly predicting 0.3C by 2014….
http://www.youtube.com/watch?v=WyDmdcPw7Uw
might he public and politicians perceive there is a little re-writing of the past going on….
Vicky Pope goes beyond the press release in the video – Harsh Realities above –
It’s not a matter of headlines, nor it is a communication issue. The stop will become a pause if and when warming will resume with the models projected ratio. Untill then, naming it a pause means that you are confident that that ratio will resume. We will see, but models are actually loosing their game with reality. Moreover, it might be true that projections show periods of no-warming, but they surely did not show this one, going for a steady decadal warming trend of 0.2°C.
I’ll accept that Joe Romm’s not a climate scientist (MIT physics Ph.D), but he is certainly a climate figurehead, and his quotes speak for themselves about the attitude of the time. He excoriates (thinkprogress.org on 22 September 2009) Andy Revkin of the NY Times for suggesting there might have been a pause. I apologise for the length of quotes, sampled from throughout his article. I suspect you’ll think Romm doesn’t make your job any easier.
‘Andy’s questionable and uber-misleading assertion — “global temperatures have been stable for a decade”’
‘But it’s far from clear the original statement is actually true! . . . Revkin’s post . . . relies exclusively on the temperature record of the leading UK climate change office, but the United States actually produces a global temperature record that paints a very different picture than the Met Office.’
‘Thus it is almost certainly the case that the planet has warmed up more this decade than NASA says, and especially more than the UK’s Hadley Center says.’
‘[Revkin’s] absurd statement that “global temperatures … may even drop in the next few years.”’
‘Revkin offers up not a single study to support that assertion, which he has put in the opening sentence of a New York Times story! In fact, the peer-reviewed literature supports the utter opposite of that statement.
‘A July GRL study predicted . . .:
“From 2009 to 2014, projected rises in anthropogenic influences and solar irradiance will increase global surface temperature 0.15 ±0.03 °C, at a rate 50% greater than predicted by IPCC.”‘
‘The key point is that three major peer-reviewed studies are predicting global temperature will rise noticeably over the next several years. If Revkin knows of one predicting they “may even drop in the next few years,” he needs to let us know because he hasn’t identified it in either his article or his equally flawed new blog post on the subject’
(Replying to my own comment rather than yours, because column getting very thin.)
In GCM output, the individual years are not valid prediction points, it is the overall long-term trend and the level (of temperature anomaly) reached that are.
I get the idea of what you’re trying to say here but you need to be careful to state and understand what you mean by ‘not valid’ – what is it in particular that makes individual years ‘invalid’ in comparison to long-term trends? It seems to me you’re treating this determination between valid and invalid in absolute black-and-white terms and that’s caused a logical leap for the conclusion stated in your final paragraph.
The reason why short-term variability is not robust across model runs (and hence averaging model runs induces smoothing) is that each run is initialised differently. Near-term weather is strongly dependent on initial conditions so each model run will evolve in different ways. However, the dependence on initial conditions is not large, in relative terms at least, when looking at the long-term temperature changes in comparable scenario or historical simulations.
The short-term variability seen in satellite MSU and radiosonde data is about the same (at least it should be) because they’re essentially measuring the same thing over the same period on the same planet. One way to think about different realisations produced from the same model is as counterfactuals of what might have happened if the industrial revolution happened in the year 1000, or 1200, or 1500 etc. In each case the initial conditions would have been different. Now imagine running the real Earth several times with the same forcing evolution but different initial conditions (starting at “1850”), then measure changes in tropospheric temperatures for each over the “1979-2013” period. The variability would be different in each so you would get a smoothing when combining all, except for the dips caused by volcanic activity.
Now returning to the point about validity, you can reasonably consider short-term variability in model runs as ‘not valid’ predictions because short-term variability is strongly dependent on initial conditions and basic CMIP5 model simulations are not initialised to be consistent with real Earth conditions at their start positions.
It appears you have understood that direct comparisons between observations and models for short-term variability are not valid for this reason, but then made a logical leap to conclude that looking at short-term variability in models is not valid for anything. This doesn’t follow.
I’ll start by admitting I’m not really sure what the average public Joe or Jane reads about the pause or climate change in general since I delve in to matter much deeper. For example, here are some things I have found:
Phil Jones from Climategate emails: “‘Bottom line: the “no upward trend” has to continue for a total of 15 years before we get worried.’”
NOAA in 2008: “Near-zero and even negative trends are common for intervals of a decade or less in the simulations, due to the model’s internal climate variability. The simulations rule out (at the 95% level) zero trends for intervals of 15 yr or more, suggesting that an observed absence of warming of this duration is needed to create a discrepancy with the expected present-day warming rate.” http://www1.ncdc.noaa.gov/pub/data/cmb/bams-sotc/climate-assessment-2008-lo-rez.pdf
Met Office in 2009: “Pauses as long as 15 years are rare in the simulations, and “we expect that [real-world] warming will resume in the next few years,” the Hadley Centre group write.” http://eesc.columbia.edu/courses/v1003/readings/Kerr.Science.2009.pdf
The communications I’m expecting from climate scientists is that “pauses as long as 15 years are rare in the simulations” yet since that is happening in the real world right now they are “worried” due to a “discrepancy with the expected present-day warming rate.”
Yet, I’m not getting the “worried” message. I’m getting explanations for the pause like Kevin Trenberth saying that the pause is actually in the deep ocean (which includes things like dominant La Nina, strong trade winds, etc.). There are many other explanations like volcanic activity, optical depth (asian brown cloud), stratospheric water vapor and so on.
So I will certainly agree with you that communication has to be better because I am getting many mixed messages.
Aargh I just wrote a long reply and lost it! Will try to remember it…
It’s a good question but requires a longish answer because it depends on a few things.
a) Invalidate for what? Predicting broad scale differences in global mean temperature from taking no action vs reducing GHG emissions vs geoengineering? Or predicting changes in the 5% most extreme rainfall events in the UK? It’s not controversial to say that climate models more valid, or useful, for the former than the latter. Conversely, a model that is poor at one thing is not necessarily invalid or useless for everything.
b) Which test? Statistical testing of whether two things are consistent is somewhat subjective, in that there are many different tests with different assumptions about the underlying statistical properties of the two quantities. People argue about the best tests to use. And different tests are better suited to different quantities i.e. (a).
c) How strictly? We know climate models are imperfect because they don’t represent everything in the earth system. Given that we know models and observations will disagree to some extent, how strict do we want to be? The choice depends on the known inadequacies of the model and the quantity chosen i.e. (a) again.
We discuss these things extensively in the literature and IPCC reports. The latest IPCC chapter on this: Evaluation of Climate Models.
Here are some excerpts from near the beginning:
“Most simulations of the historical period do not reproduce the observed reduction in global-mean surface
warming trend over the last 10–15 years. There is medium confidence that the trend difference between
models and observations during 1998–2012 is to a substantial degree caused by internal variability, with
possible contributions from forcing error and some models overestimating the response to increasing
greenhouse-gas forcing.”
“Models are able to capture the general characteristics of storm tracks and extratropical cyclones, and
there is some evidence of improvement since the AR4. Storm track biases in the North Atlantic have
improved slightly, but models still produce a storm track that is too zonal and underestimate cyclone
intensity.”
“Current climate models reproduce the seasonal cycle of Arctic sea-ice extent with a multi-model mean
error of less than about 10% for any given month.”
Hope that helps!
Ahem. As you say, Joe Romm is not a climate scientist. I would say he is definitely not representative of our views…
We try to point errors and misrepresentations in the media and blogosphere where we can. But when only a few climate scientists are doing it, we can’t answer everything.
I am also an admirer of Judith Curry. It is appalling that she has to be so brave just to communicate her ideas. The saddest thing I read recently on her blog was this. It says a lot about climate science.
“With regards to climate science, IMO the key issue regarding academic freedom is this: no scientist should have to fall on their sword to follow the science where they see it leading or to challenge the consensus. I’ve fallen on my dagger (not the full sword), in that my challenge to the consensus has precluded any further professional recognition and a career as a university administrator. That said, I have tenure, and am senior enough to be able retire if things genuinely were to get awful for me. I am very very worried about younger scientists, and I hear from a number of them that have these concerns.”
Tamsin said: ‘Maybe you have specific examples in mind?’
The Met Office comes to my mind, eg http://metofficenews.wordpress.com/2012/01/29/met-office-in-the-media-29-january-2012/
” . . . to suggest that the latest global temperatures available show no warming in the last 15 years is entirely misleading.” Just one example of many.
This is a fair question and I’m trying to find time, or if not another colleague, to answer it for you. Bear with me!
Hi Tasmin
Under what circumstances and duration would models and observations become inconsistent?.
Hi Tamsim,
Something to ponder…
If we take Ben Santer’s requirement that we need 17 years of annual temperature data to obtain a statistically significant answer for a warming or cooling trend, and for the sake of simplicity lets just assume we can test the significance of the correlation of temperature with time over a 17 year period using a Student T test (actually slightly optmiistic if there is any inter-annual correlation), we find that for 95% significance we need a correlation R > 0.482 (or < -0.482 for negative trends).
On those crteria there has been no statistically significant increase in HADcruT4 for the last 2 years. Ok, theres our flatlining temeprature series, but that's not my main point.
More interesting , I think, is that if you apply the same criteria to the warming period on which so much import is placed, you find that the continuous period of statistically significant warming is only 26 years (from 1986 to 2011). And in the latter part of those years the rolling correlation with time is coming down quite rapidly to no significance from 2012 onwards, because the last 18 years have no significant trend.
Just read that number again: the period of continuous statistically significantly warming is only about 26 years. AS reported in the CRU emails, "what if its only a multi-decadel variation?".
This is not a problem of communication unless you take the view that AGW is irrefutable. No science is irrefutable. Rather than worrying about communication, I suggest a proper an honest re-engagement with the scientific process where every alternative scenario to AGW is stated, compared and contrasted.
Those believing the science is irrefutable would do well to read some Feynman. I would suggest a good place to start is "The Pleasure of finding things out" which contains several essays which climate scientists should read before modifying their behaviour, worrying less about "communication" and start thinking "could my basic premises be wrong".
Hi Tamsin,
You say
“Climate scientists were aware a pause like this could happen (because there are natural cycles on all timescales), but couldn’t predict exactly when it would happen (this is much harder because of chaos).”
If they were aware of it they failed to communicate it to the public either directly or via the media who, prior to about 2005, communicated global warming as something that was happening and would continue to happen at an accelerated rate. The IPCC likewise did a very poor job of communicating the likehihood of any pause due to reductions in radiative forcing or internal climate variability.
But really, a 17 year pause, in all honesty, was not predicted with any statistical significance by any of the climate models. As it continues, the discrepancy becomes ever more glaring. I refer to the Meehl et al paper 2013 which states:
” . . . . there are 9 instances of 11 year zero temperature trends, 6 instances of 12 year zero temperature 178 trends, 5 instances of 13 year zero temperature trends, 3 instances of 14 year zero temperature 179 trends, and 1 instance of a 15 year zero temperature trend.”
Further, this paper
http://www.academia.edu/4210419/Can_climate_models_explain_the_recent_stagnation_in_global_warming
from Storch which says that
” . . . . . we find that the continued warming stagnation over fifteen years, from 1998 -2012, is no longer consistent with model projections even at the 2% confidence level.”
That’s for a 15 year pause. It’s now 17.5 years and ongoing. But crucially now, the argument has moved swiftly on and whilst it would be desirable for climate scientists to communicate directly their thoughts on the pause via readily accessible blog material, the talk of the moment is now ‘extreme weather’ and why that now is supposedly (according to some at least) a definite indicator of man-made climate change. We urgently need to be hearing from climate scientists their balanced assessments of 1. Why warming has stopped and 2. Whether the seeming increase in extreme weather patterns across the globe can be attributed confidently to global warming or whether there are other, perhaps more likely causes.
Sorry, with regard to the Meehl paper, ignore the 3-digit paragraph markers in the quote! Also, forgot to say that this is for 375 years of model runs, so just 1 instance of 15 year pause in 375 years.
From the recent APS climate seminar transcript:
DR COLLINS: “I do not have an opinion. We thought while we were writing this report that it was aerosols. And there were a number of — people became very alarmed. There were four meetings that went into this report, four face-to-face meetings. As of the second, we were having these frantic meetings between people like myself on radiative forcing and the later chapters that were looking at these projections saying oh, my God. The models are running hot. Why are they running hot? By “running hot,” I mean running hot for 2011, 2012 as we were writing the report.”
DR COLLINS: “Now, I am hedging a bet because, to be honest with you, if the hiatus is still going on as of the sixth IPCC report, that report is going to have a large burden on its shoulders walking in the door, because recent literature has shown that the chances of having a hiatus of 20 years are vanishingly small.”
15 years? 20 years?
None of this was predicted, this is not an issue of communication. Climate Science has been caught with its pants down. And every comment and claim is retrospective. If you want scientists like myself to believe in these models you have to produce clear, testable predictions over, say, a 10 or 20 year period. Clearly defined, clearly written down. Not armwaving double speak like from the Met Office.
The first problem in all that is actually defining something you actually could predcit and test, I suspect.
Otherwise you should take the recent advice of Richard Lindzen to the UK parliamentary committee – the best thing to do is…to do nothing and wait for 50 years.
I think the most honest document I have read on climate models and the science is the APS climate seminar transcript which was made available recently. Its long but well worth reading in its entirety.
http://www.aps.org/policy/statements/upload/climate-seminar-transcript.pdf
Tamsin: Use Firefox and get the Lazarus plugin. No more lost replies.
The “worried” message is clearly going on behind the scenes. See the APS transcript from which I quote elsewhere on this thread. I think there are moments of honesty shown there (perhaps when they forgot it was all on the record and recorded…)
http://www.aps.org/policy/statements/upload/climate-seminar-transcript.pdf
Hi Tamsin,
In the same Nature issue your article appears in, Lisa Goddard writes:
“Interestingly, no one really talks about the other side of this situation: global warming acceleration. The mid-1970s through to the mid-1990s was a period of positive PDO and saw an acceleration in warming. If you consider the arguments about the effect of the negative phase on warming, then a positive PDO should result in the opposite. That is, reduce the relative rate of deeper ocean heat increases and instead increase the rate at which surface warming is observed.”
But if PDO is just internal variability, why doesn’t Lisa discuss the reduction in trend of AGW that is the necessary deduction? Since the 1975-2005 warming was around the same magnitude and rate as the 1910-1940 warming, before co2 increased much, then there is a problem, Houston.
How much of the modern warming was the positive phase of PDO ( & AMO)? Got to be a big percentage, or theory can’t account for the amount of ‘missing heat’ hiding down Davey Jones underpants. So where’s the balance point? 75% Ocean oscillation 25% co2?
Plenty of mixed messages about the ‘pause’ – some saying there is no pause, and then around 9 excuses/explanations or partial explanations for the pause. I wouldn’t hang your hat on the ‘heat hiding in the oceans’ paper. There may not actually be any ‘missing heat’ in the oceans (Trenberth et al 2014).
Minds have to be open to the possibility that climate has a low sensitivity to CO2 – at the low end of IPCC projections and that 3c or more of warming will never be a reality regardless of what climate models say.
Also, the fall in solar activity (not just TSI) evident in solar cycle 24 (and will be even lower through cycles 25 and 26) was predicted 3 decades ago along with an end to warming, with the coldest phase around 2030. Over 17 years on non-warming or cooling could become a trend of 30 years or more. Hopefully that will bury climate alarmism forever!
To me, it’s as if Climate Science is saying:
1. We are attempting to model a more complicated physical system than has ever been attempted before.
2. Our models have not been validated, because there is no way this can be done*.
3. The predictions of the models have not matched reality.
Anyone who has been involved in producing and testing simulation models in other fields would count [3] as the completely inevitable consequence of [1] and [2]
*I know that the Met Office has said that their models have been validated by the fact that they can reproduce some past climate history. This seems to me to be the fallacy known as “testing on the training data”. It is possible to have models with completely wrong representation of the physical effects which still reproduce past history correctly.
Link 32 in the report takes us to Doug McNealls links page. There are a lot of science sites but in the Other climat-y blogs worth reading I would of thought that a very shallow pool to point people to for information. Perhaps there should be some inclusion of blogs that have won bloggie awards in the scientific category or is that a bit too far advanced for this stage of communicating the science to the public?
Tamsin, it is a commonplace in the skeptic world to talk about a “pause” starting at 1998 while never mentioning trends since 2000 or 1996 (say). Such cherry picking is to be expected from them but I find it most odd that a scientist like you should play along.
Thanks for the APS summit report. Will look through it. I’m sure, besides being informative, there’s much to amuse, bemuse and confuse your average ‘climate sceptic’!
Couldn’t agree more with your comments above. We need far more substantive explanations from the climate science community, substantive enough to stop politicians and environmentalists keep upping the ante on ‘climate change’ with their increasingly urgent calls for action (seemingly backed by increasingly bizarre and non-evidenced claims). Of course, if climate scientists have evidence that backs these claims, sceptics would very much like to hear it.
“The “worried” message is clearly going on behind the scenes”
It has to be, in only 15 years 1998 to 2013 CMIP5 all RCPs have gone from breaching the high confidence level (hindcast) to a projection breaching the low confidence level see Ed Hawkins chart:-
http://www.met.reading.ac.uk/~ed/bloguploads/FIG_11-25_UPDATE.png
IIRC the first CMIP5 runs were in 2007 so the slowdown was not only not “projected” but neither was its existence captured. As in many instances it is the rate of change that is pertinent.
Sundance: “Tamsin in your mind is there any test or criteria that could invalidate current climate models?”
This article by Hans Custers lists 1o ways in which the global warming hypothesis could be falsified, invalidated.
A clear one would be an unexplained drop in surface air temperature back to 19th century levels for several years. Another one would be a similar reduction in ocean heat content for a year.
What happens to the slowdown in the surface temperature trend is not that relevant for the global warming hypothesis. If it continues much longer, one may want to study the natural variability of the climate in more detail. This is also what you see happening, examples are mentioned by mpcraig above.
It’s not really a communication issue, is it? It’s a cognitive dissonance issue.
As we all know climate is an extremely complex coupled non-linear system. Since I’m a cynical old engineer, I suspect this means it is not susceptible to being modelled at all, no matter how much computing power you have.
Forgive me for saying so, but the pause shows your models are not up to the job, do not describe the real world, and have zero predictive capability. Yet the liberal arts morons who infest public life – and spend all our tax money – have decided, due to their religious faith in the output of the computer models, that they are going to impoverish our society through deliberately encouraging inefficient unreliable expensive energy sources (if a windmill may even be characterised as such, given they produce nothing much of the time). Future generations will look back and wonder at it, to say the least. In the meantime, when the penny drops that the whole thing really is complete utter balls, be prepared for the political classes to dump all the blame on you academic climate scientists.
Rough old business, politics.
The crux of the matter is: internal climate variability, particularly PDO, has been responsible for oscillatory warming and cooling, superimposed over a more gradual warming trend since the end of the LIA. It looks very likely that internal climate variability was responsible for more than half of the observed strong warming trend in the ’80’s and ’90’s and is probably also partly responsible for the current surface warming hiatus. The gradual warming trend we might reasonably suppose to be due to increasing solar activity.
Precisely where does all this leave CO2 AGW? With a little elbow room I surmise, not enough to really muscle in on the main players. There is also the seemingly little discussed issue of how much ‘internal variability’ is moderated/accelerated by external climate forcings.
We haven’t had a 15 year pause in the observations. As defined in your quotes,a ‘pause’ is a trend of less than (or equal to zero). As Figure 1 in Tamsin’s post shows (and in the paper itself), the trend in HadCRUT4 is still positive (+0.04K/decade) over the past 15 years.
Of course, there are the other natural forcing factors to be accounted for as well – some small recent volcanic eruptions, and a relatively weak solar cycle may also be helping keep temperatures slightly lower.
cheers,
Ed.
Doesn’t that rather put the cart before the horse?
Not sure of the tekkie terms, but aren’t you making a null hypothesis of ‘the models are right’, which will only be falsified if they can be conclusively shown to be wrong?
Maybe I;m being a bit overcatious, but if our national and international policies are going to rely on these models, shouldn’t we be having a much higher standard of proof than ‘haven’t (yet) been shown conclusively to be wrong’?
And there are potentially an infinite number of possible models out there. How do we know that the 107 (or whatever it is) that have actually been made ‘concrete’ are the ‘right’ ones from that infinite set?
Hi Tamsin
How strictly?
Strictly enough to justify the horrendous amounts of money being squandered to tackle this ‘settled science’?
“We haven’t had a 15 year pause in the observations. ”
With all due respect Ed, this is part of the communications problem.
RSS shows a trend of -0.05. Regardless, +0.04 is a lot closer to zero than the climate model projected trend.
And I’m not knocking you or Tamsin as climate modelers but rather you should start questioning the climate scientists that are feeding you the assumptions and parameters you are putting into your models.
This is part of the communications problem. Lots of people question these assumptions, why don’t you? Perhaps this is the part behind the curtain which we don’t see?
One last comment. When a scientific prediction begins to go awry, there are many things to look at to try to make progress. One of the main ones is that the hypothesis is wrong.
In my reading of the communication from mainstream climate science, the possibility of the hypothesis being wrong is not even mentioned (or only rarely and fleetingly). The only exception I can think of is Hans von Storch.
If anyone is looking for a good example of a climate scientist trying to communicate (including the pause) and being successful, I believe this is one: http://www.spiegel.de/international/world/interview-hans-von-storch-on-problems-with-climate-change-models-a-906721.html
mpcraig,
All the quotes you listed are about surface temperature records. RSS is an analysis of the lower troposphere.
Regardless, +0.04 is a lot closer to zero than the climate model projected trend.
But ‘closer to zero’ isn’t zero and zero, or lower, trend was the basis for the quotes you presented. I guess you could argue +0.04 isn’t significantly different from zero, hence scientists shouldn’t be acting significantly different from worried 😉
By the way, investigating is what scientists do when they’re “worried” about something. Not sure why you’ve constructed a dichotomy between concern and investigation.
Thanks, but I’m not really here to argue specific points with anyone.
It’s more to show examples of my skeptical thinking. I’m hoping that’s a good catalyst for improving communications.
Michael,
Some links to your assertions would help… but some replies:
1) Where has the observed trend since 1960s been changed in the IPCC report?
2) There HAS been a temperature rise since 1998 – the graph in the post shows it – +0.04K/decade = 0.06K. Not zero.
3) There is no such thing as a purely empirical estimate of climate sensitivity. All the estimates rely on complex models to derive the forcings (especially aerosol), and a simple model to relate forcing to temperature. It is not true to state otherwise. Or do, you refer to the purely curve fitting exercises done by some?
cheers,
Ed.
Can you put a likelihood on various durations of pauses or slowdowns?
Is it 1% of models runs that exhibit these, 10%, 50%, 100%?
Also, how does this change with regards to the climate sensitivity of the model?
If it is more likely to happen in low warming models than high warming ones, shouldn’t the model ensemble be evaluated with that in mind?
One question I’ve been asking is if there is a substantial difference between high and low sensitivity models in the short term? Do they exhibit steady increase in temperatures or acceleration? When I tried to evaluate this, I had trouble locating high sensitivity model runs(>4C)
Tasmin,
Do the models explain why rate of warming between 1910 – 1940 is about the same as the rate of warming between 1975 and 2004?
Please remind me of the first IPCC ‘Summary for Decision Makers’ that predicted the cessation of temperature rise which has lasted these past 16 years?
Naturally there are lots of statements about variability and decadel-length fluctuations. The Infinite Monkey Theorem springs to mind. Virtually every combination of outcomes is predicted somewhere, simply as an @rse Protection Factor.
The earth is now closer to a two-decadel than one-decadel cessation – was that predicted in all the IPCC reports?
How many contributors to the IPCC assessments have publicly admitted “I was wrong”?
Such consistent failure in any ‘normal’ business would result in dismissal. Poor taxpayers simply get shafted for extra funds.
[BTW – the layout with ‘latest comments at the top, with comment-replies below’, is a real PITA to read, it’s an ergonomic nightmare . Fortunately, nearly all other blogs use the conventional ‘earliest comments at the top’, which simplifies chronological reading of comments.]
zero is not the issue…!!
the trend is about a quarter of what was projected…
and I really hate the graphic
if you are going to put a trend line in the 30’s-40’s 0f 0.06 per decade..
why not also put on in for the last decade or so as well
ie an ACTUAL trend vs a projected one.
To me, it’s as if Climate Science is saying all the things you say, with the addition of ‘…and mankind must pay $trillions now, on the off-chance we may be partially correct.
The scaremongers build careers, often at taxpayers’ expense, predicting all the possible detrimental outcomes of a century-long temperature change which is a mere fraction of a diurnal swing; yet are deafeningly quiet about the benefits which statistically have to be numerically close to the number of ‘disadvantages’.
Ed
You are torturing the +0.04k/dec, are you saying that it is statistically significant? What is the uncertainty for the graph data +/- 0.1K?
Could we have a nice solid line for the trend to date..
Ed Hawkins says:
February 26, 2014 at 4:53 pm
“We haven’t had a 15 year pause in the observations. As defined in your quotes,a ‘pause’ is a trend of less than (or equal to zero). As Figure 1 in Tamsin’s post shows (and in the paper itself), the trend in HadCRUT4 is still positive (+0.04K/decade) over the past 15 years. ”
Quite so. In addition, HadCrut4 suffers from coverage bias in the 1998-2012 period. More credible trend estimates for 1998-2012 range from +0.07C/decade (NASA Gistemp) to +0.12C/decade (Cowtan & Way), nowhere near the NOAA zero trend threshold. I do hope these more reliable estimates were at least mentioned in your commentary.
For the same reason, Tasmin should stop referring to the “pause” in surface global warming and use the more correct term “slowdown”.
Tamsin, your chart which cherry picks similar low or no trend periods from a large range of simulations has no standing in statistical terms.
It is the equivalent of pointing out that someone won the lottery and offering that as some form of evidence that collectively we have found the correct model to explain and hence predict the outcome of the lottery.
I would have thought a model use would know such basic stuff.
I designed built and ran large scale macro-econometric models for many years. I would have been laughed out of academia if I had done something similar.
Ed Hawkins,
We’ll call it an ‘effective pause’ shall we, in the knowledge that the five different datasets all produce slightly different trends with one, or more, as I remember, showing a very slight cooling trend since 2005, but all showing a statistically insignificant warming or cooling trend in the said period. That should dispense with the nasty business of us calling certain AGW proponents ‘pause deniers’ and certain AGW proponents labelling ‘climate sceptics’ as ‘climate deniers’ etc.
What you have to realise, Tamsin, is that the climate models are incapable of predicting the future because of three major errors:
Well, Keenlyside et al. 2008 did predict a lull in global warming based on a model initialisation exercise:
‘Our results suggest that global surface temperature may not increase over the next decade [, as natural climate variations in the North Atlantic and tropical Pacific temporarily offset the projected anthropogenic warming.’
It was widely and heavily publicised at the time (e.g. here and here) but apparently that didn’t affect many peoples’ perception of whether or not a pause was possible.
Ibrahim: your question was asked by Richard Lindzen of the climate modellers in the APS climate seminar transcript – its a long way down the document (the link is given elsewhere under one of my comments in this thread).
Lindzen asked do they reproduce that warming? The modellers started to talking about greenhouse but he quickly pointed out the greenhouse effect is irrelevent in that period. The modellers then admit they don’t really reproduce that warming and get the timing of the peak wrong (as I recall). Basically, they do a poor job on it.
Its the little questions that bring down the big theories. Why don’t they reproduce that warming?
Oops, that should be:
For the same reason, Tamsin should stop referring to the “pause” in surface global warming and use the more correct term “slowdown”.
Sorry about that!
Tamsin: The fundamental way science progresses is by proposing hypotheses and TESTING them. When you can’t give a straightforward answer to this question (What test or criteria could invalidate current climate models?), are you speaking as a scientist or an advocate?
[Hey! It would be wrong to give a “straightforward” answer – by which I assume you mean short – that didn’t acknowledge the nuances and how poorly-defined such a question is — Tamsin]
From my perspective, climate science allowed a very public test of current climate models by not objecting to a prominent 2009 Science article by Kerr: “What Happened to Global Warming? Scientists Say Just Wait a Bit.” Kerr cited scientists saying that GCM output showed that 10-year pauses weren’t uncommon (17 such pauses in 700 years of output), but 15-year pauses were rare. Now that models have “very likely” or “extremely likely” failed this test, it’s time to come to grips with the issue and respond appropriately.
[I’ve written in other replies under this post – 15 year pauses might be rare if there was nothing else changing, but if there are *also* changes in forcings – e.g. sun and volcanoes – they can make them more likely.]
The graph in this post, which provides examples of periods of insignificant warming – but no data about their frequency – reeks of cherry-picking and doesn’t address the issue the likelihood that models are failing.
[Ha! That’s the whole point 🙂 By cherry-picking one short period we can come to the wrong conclusion. We need to look at the whole long-term trend.]
(Unfortunately, I don’t have access to this pay-walled article, so I haven’t read the discussion and may have judged unfairly.)
[Fair enough – you can either register for free access or send me an email to request the pdf.]
The authors of AR5 responded to the “failure” of earlier model projections by quietly reducing AR5’s projections for short-term, but not long-term, warming after the second order draft had been reviewed. Such inconsistency is characteristic of politics, not science.
[Decadal predictions are different to long-term projections though. You can have the same model doing both, but a change in the initial conditions will make a much bigger difference to the first than the second.]
You can, of course, debate the purpose of climate models and degrees of statistical certainty [My favourite pastime! — T], but most IPCC SPMs are filled with conclusions that are merely “likely” and occasionally “very likely”. If “very likely” conclusions in the IPCC’s reports aren’t considered meaningful (like the “very likely” failure to predict the pause), there is little of substance left.
[“Very likely” is the phrase given to greater than or equal to 90% uncertainty range. Is that really meaningless? Plenty of decisions are made on much less confident assessments…]
This doesn’t mean that your basic strategy is flawed – it still makes perfect sense to develop climate models based on fundamental physics and chemistry that has been rigorously tested in laboratories. The problem presumably arises from the parameters used to describe sub-grid processes and the methods used to tune them. Those parameters aren’t rigorously tested in the laboratory and sequential optimization can lead to local optima, rather than a global optimum. My guess is that model developers probing this intractable parameter space were biased by groupthink and a desire for a model that closely reproduce the historical temperature record. (What government would continue funding a climate model that did an inferior job of reproducing the historical record?) Unfortunately, the historical record contains an unknown amount of unforced variability (1940’s warming, today’s pause, 1960’s cooling?, 1980’s warming?), as well as potential warming bias (from undocumented breakpoint corrections).
Each set of parameters represents a different hypothesis to be tested. GCMs may simply need a set of parameters that produces a lower TCR or greater unforced variability, and does a better job of describing today’s climate (not the historical record). There are plenty of phenomena to exploit with longer and more reliable records which current models describe poorly (the hot-spot in the upper tropical troposphere, regional seasonal climate change, ENSO) and new data (ARGO). Judith Curry has been encouraging more effort on model basics and less on model projections, but that won’t happen unless modelers admit – to themselves at the very least – that current models are inadequate.
[This is my research area! The inadequacy of models 🙂
You’re right that the parameters aren’t generally tested in the lab – though they are tested with observations of the real world where possible – because often they are abstracted from real quantities. I absolutely agree with you that optimisation can lead to local optima, of course, a particular danger when you have models that are too expensive to run many simulations. But there are ways round that. Probably the most intensively studied climate model in the world is the UK Met Office’s HadCM3 (an old-ish version of their Unified Model), which was used for the UK Climate Projections 2009. For example, the distributed computing project ClimatePrediction.Net has run about approximately a gazillion different HadCM3 simulations perturbing many parameters at once. And several people have used emulation, i.e. statistical modelling of the dependence of the model output on its parameters, to search for local optima. In fact, when you have such a high dimensional parameter space and sparse observations of high-dim output, you do tend to find multiple similar optima. So that’s why we incorporate the spread of results from these big ensembles as an estimate of the parametric uncertainty…i.e. detuned model results *are* incorporated.
By the way, models are most often tuned to mean climate states, not the historical trend. (Because they’re too expensive to do many long simulations.)
I can send you some references if you want. — Tamsin
Just like any other scientific hypothesis, we can never *prove* that the models are right. We can only disprove them.
The more things the models successfully reproduce, and the longer they go without being falsified, the more confidence we should have in them. (And indeed, they do reproduce a lot of the aspects of the actual climate).
The opinion of this “average public Joe” is that AGW is so tied to individual climate “scientists” pay checks and reputations that they are now…
[I snipped this for its accusations and insults about climate scientists (“lies”, “charlatans”, “criminals”, “parasites”, as well as “scientists” in inverted commas). I’m a climate scientist, and I won’t be insulted in my own online home. This is a blog where we aim to have respectful conversations about science and its communication, rather than sling insults. — Tamsin ]
I should think that calling the recent period a pause is correct insofar as public discussion is concerned. Nobody has had a problem with discussing the two previous pauses in the historical temperature record in those plain English terms.
I can certainly understand your desire to preserve a ‘line in the sand’ regarding descriptions of what is going on, but the issue has been discussed enough that the label is probably okay.
From the Lukewarmer standpoint, describing this as the third pause in the last century does not imply any cessation of warming or prediction of the length of the pause.
Defenders of the consensus do have the oft-remarked habit of defending every point long past the point of diminishing returns. Shall we talk about the phenomenon or continue to debate the label?
I think the interesting issue is the fact that this is the third such pause. It to me indicates that there is something fairly fundamental that we are not understanding.
I think a more compelling line of argumentation would go something like this: “A variety of pseudocycles have flipped from a state of contributing to warming to subtracting from warming. And yet, despite their fairly substantial influence, temperatures have merely stabilized, not gone down.”
This is why it is unfortunate that climate models got drafted into the peculiar position of forecasting atmospheric average temperatures at such a fine degree of resolution.
The model outputs I have seen do a really good job of showing broad movements over time. But those broad movements are really not useful in showing something like decadal swings of such a low value.
To me, models are a huge success story in their own right. However, I really feel they are the wrong tool for calculating the values being debated currently.
Doesn’t the word ‘pause’ itself do some rhetorical work that is questionable. To my ear it implies that it is minor and that it will be followed by a resumption of warming. This might be what many people believe, but we will really only know in retrospect. I would prefer something like a ‘halt’ to warming. Then, if warming resumes, we can retrospectively call it a ‘temporary halt’ or ‘pause’ or ‘hiatus’ and if warming doesn’t resume it is a ‘permanent halt’ or ‘the start of a fall’ or ‘the top of the temperature curve’ but only retrospectively.
We don’t actually know what will happen in the future, and our language should reflect this if we wish to be accurate.
[I take your point, language is important, though we are pretty confident that unless cooling forcings massively increase temperatures will go up again due to the inertia in both the climate and human systems. Having said that, some people (not climate scientists) have seemed to object to us using the word pause instead of slowdown. I’m comfortable with pause rather than slowdown, given that the increasing evidence for a non-zero trend such as Cowtan & Way is still quite new. — Tamsin]
I think I would be more impressed had the models predicted the “pause” before it occurred rather than after.
[They didn’t attempt to…they only ever aimed to capture longer-term trends. Decadal predictions do try to, but they rely on having sufficient observations to give well-defined initial conditions. Ed’s the expert in that area.]
‘@Tamsin: but couldn’t predict exactly when it would happen (this is much harder because of chaos).
No… If Lorenz got it right, not “harder“, “impossible”
[Yes and no. No, because some aspects of variability – say, in surface ocean temperatures – persist long enough to allow prediction on longer timescales than you would expect for the chaotically-driven weather. Yes, because that applies more to month-to-annual timescales than the decadal length of the pause (though I am not an expert in this area e.g. on the Pacific Decadal Oscillation).]
Reality check needed here Ed. 0.04K per decade? What is 0.04K? How accurate is your thermometer? How does 0.04K compare with the Met Office prediction of 0.3K? See mpcraig comment.
If one or more models predicted this pause then why not just look into those models and see which of the laws of physics has caused the pause?
[Good question. Variability like this isn’t hard-coded in as physical laws (e.g. there’s no “do El Nino” code), it emerges spontaneously from the complexity of the system. But you can look at what things are changing in the model – like in the Pacific, where we can look at the ocean circulation patterns to see if more heat from the atmosphere is being taken to lower depths than at other times. Then look at what else is happening, e.g. changes in wind or cloud, to understand the mechanisms, the causes and effects, and whether they are similar to those being seen now. I’m not an expert on this but I think current models don’t show the exact pattern of changes in the Pacific we’ve seen recently, except for some recent studies where they kept the surface temperatures of the ocean very tightly constrained to the observations rather than letting them evolve within the model. That’s a bit off the top of my head, would need to check it. — Tamsin ]
Pertinent, perhaps?
“Smith argues that the climate community has oversold climate models. ’How do we ease user pushback when the current oversell becomes clear?’ He then asks the questions: Can (we) climate modelers stop digging? Information we are supplying which is not ‘adequate for purpose’ is being interpreted as if it was. A wave of valid criticism of the presentations and interpretation of models may well come from physics, statistics and even (has already come from) honest policy-maker IPCC –questions. The political/public interpretation might be that the anti-science lobby was right in the first place. How do we clarify limits of our understanding on more favourable terms? ”
http://judithcurry.com/2014/02/18/uk-us-workshop-part-iv-limits-of-climate-models-for-adaptation-decision-making
Suppose there were 10 models. Five of them predict ‘global warming’ to occur at the rate of 0.2 C per decade for 100 years. Suppose, that the other 5 predict cooling at the rate of 0.2 C /decade for 100 years.
I ask you to pick a single reliable model. Which one would you pick?
The answer is none. Because every model has a counterpart producing the exact opposite trend in the timescale concerned. An individual model is no better than a coin flip. 50:50.
In the case above, trends such as the one shown by the purple line are meaningless in any single model because they don’t exist in the multi-model mean.
Your point about differences in initial conditions is another way of the saying the same thing: models are no good for short-term, i.e., multidecadal, trends.
Replying to Cameron Rose: February 26, 2014 at 2:50 pm
I personally don’t think it’s a good idea for scientists to say there has definitely been no pause *unless* they are very clear that they mean no pause in overall climate change (because of other things changing than global average surface temperature), or else they are talking in the past year or so during which there has been more evidence that it’s a slowdown not a pause.
Good question, but it’s more that we are *constantly* testing whether they are wrong/useless. From these tests we currently judge them to be good enough, at least for many aspects of the climate system.
And about models. In a sense we have many more model versions than that – we run them with many different parameter settings to check how much the results vary (and include this as part of the uncertainty estimate). But that’s not changing the structure. For that we just have to try and quantify how wrong that subset are, by comparing them with as many observations as possible – ideally from multiple different climate eras so that the results are more robust. I presented a public talk on a Bayesian approach to this at a Royal Met Soc meeting a while back.
Exactly! And the catastrophic predictions for the year 2100 were and still are nothing more than an extrapolation of what actually occurred during 1975-1998, no matter how sophisticated the models purported to be. This is why the “pause” is significant.
[On the contrary, climate models are not simple extrapolation. That’s why we use them, rather than actual extrapolation using statistical models. There are ways in which we expect climate to respond differently in the future, both more severely (e.g. warming amplified by reducing Arctic sea ice or the reduced reflectivity of Greenland ice from melting) and less severely (e.g. Greenland ice losses reduced in future because there may be self-limiting mechanisms or changes to the ice contact with the sea.
If we were using simple extrapolation, with statistical modelling, of:
– only the very recent period
– without any physical understanding of the changes in forcings during that time or the future
– without any physical understanding of how the response to those forcings might change during that time or the future
– without any estimate of the internal variability that leads to short-term changes in trend
then yes, we might – in error – think the pause was significant. Luckily we don’t take such a simplistic view… — Cheers, Tamsin]
Arguing that +0.04K/decade is greater than zero when you are dealing with experimental quantities that have larger uncertainties than this, is not a good way to mollify skeptics.
Unlike the image given by some, many so-called skeptics have advanced training in math, engineering and/or the physical sciences , and this isn’t their “first rodeo”.
I think the biggest “communication problem” that climate scientists are having is they often are assuming they are talking to the general public, when they are actually talking to peers.
Ed, I think I will respectfully disagree 🙂 If HadCRUT4 is 0.046 ± 0.063 for 1997 to 2012 (as it says in Cowtan & Way), then that’s consistent with zero, no? There is of course increasing evidence it’s a slowdown, such as C&W itself (e.g. kriging method: 0.108 ± 0.073), but it’s not super-strong yet in my opinion.
This is one of the common points of confusion I wanted to add to our article 🙂 Some scientists say there’s no pause, some say there is. To me it’s more important to discuss the *implications* of a pause or slowdown for our understanding of climate and our models. And leave the question of the exact trend to be gradually answered with more research and data.
Can’t bring myself to read all 573 pages! Feel free to give me a quote…
Those were not “initialised” projections — i.e. they only aim to simulate the multi-decadal trend, not shorter-term…
mpcraig February 26, 2014 at 2:39 pm
I haven’t looked at those quotes you give in detail. But I think there’s one point I want to make. It might be “worrying” if there were big mismatches between models and observations (for a long time) *without any proposed explanation*. But we think that internal variability, and reduced forcings, can explain the differences. The model projections are not “initialised” ones (i.e. they are only trying to predict multi-decade trends, not shorter-term changes), so we didn’t expect them to get the *timing* of this variability right.
Thanks! Though I am a fan of Chrome. Normally I am more careful about saving longer replies elsewhere.
You don’t think it’s worth spending money trying to understand the climate system…? (Perhaps I misunderstand you)
Thanks Victor, that’s a really interesting blog post.
It also mentions “without a clear cause” as a prerequisite, just as I wrote 7 mins ago (comment at 12:57 pm) before I read it 🙂
Am going to restrict this comment to the observations only. You can all read my views on the comparison with models elsewhere:
http://www.climate-lab-book.ac.uk/comparing-cmip5-observations/
The best estimate from HadCRUT4 is +0.04K/decade from 1998-2012. Other estimates, such as the infilled Cowtan & Way dataset, show a larger trend. Yes, there is uncertainty in this, but assessing the “statistical significance” of the trend is fraught with difficulties in assessing and interpretation, and arguably pointless as it depends entirely on what noise model is assumed (see the discussions in Parliament with Lord Donoghue etc).
So, there has been a slowdown in the rate of surface temperature increase in the most recent 15 years, but as measured by HadCRUT4 the best estimate of the trend is still positive.
Ed.
Thanks TS. I agree no science is irrefutable.
But why would you read much into the number of years of warming when you have continuously changing proportions of positive and negative forcings (both human and natural) during that time? How would you know *just from the slope* whether it was negative forcings cancelling positive ones, or no forcing at all?
And do you really think we haven’t done this: “every alternative scenario to AGW is stated, compared and contrasted”? How much have you looked at, say, coverage of the cosmic ray mechanism in the IPCC report? Or of the contribution of internal variability? Or all the possible combinations – including amplification of – natural forcings? Or the studies of how different types of forcing have different spatio-temporal effects (for example, vertical pattern of warming)? I appreciate the IPCC report is very long- just a genuine Q to ask how much you have delved into it all.
I did a whole 10 mins on how much I love Feynman – and try to live my life like him! – for Robin Ince’s show about him last May… I quoted the “bending over backwards to show how maybe we’re wrong”, followed by a screenshot of my blog page 🙂
The basic CMIP5 model simulations are no good for predicting the short-term variability which we will see in the real Earth system. However, that’s not relevant to Figure 1a, which you describe as ‘wrong’.
What the figure shows is that variability is expected, therefore periods where trends are smaller or even negative can occur despite an overall warming trend. They’re making no claims for a time-dependent prediction, just a prediction that such periods might happen at some point.
I take your point, but:
a) they use only one climate model (though I don’t know off the top of my head whether it has similar variability to others) – it would be more robust if repeated across all models;
and more importantly:
b) those simulations do not change the natural forcings, as did happen in the past 15 years, so they quantify only the internal variability part.
If you were to add an increase in cooling forcings on top of that variability, as we had in the real world, the pauses would be more common and longer.
Thanks for the quotes. I wasn’t part of (any) IPCC conversations so hadn’t heard those. I suppose my conclusion is:
1. The pause is, as we wrote in our article, at the edge of our understanding, so scientists inevitably still disagree about the exact proportions of the the different drivers and therefore its implications.
2. This is why it’s more important than ever, as we also say, to talk about the complexity of the topic, the different viewpoints put forward, and the evolving body of evidence – *not* to give an over-simplified message.
Tamsin,
I am not reading anything into the number of years of warming other than its a very surprisingly short period on which to base a theory that is then used to advocate the transformation of the entire world economy. I am with Lindzen on this – do nothing, wait 50 years and then see.
Your comment about the forcings – well the forcings in the models are themselves unknown and estimates, so the problem has be the “proof” of AGW is balancing + and – forcing arbitrarily.
You need to read the APS transcript.
Examples of huge holes in the whole models as evidence argument:
The forcings used are unknowable and are themselves estimates, this is especially true for aerosols.
Standalone model runs to independently benchmark contributions of individual parameters are not run as IPCC takes priority on model runs in general
The “fingerprint” of CO2 warming in the models may be clear in the models, but its clearly not detectable in the real world and, given its magnitude and current measurement, unlikely to be detected even it were there.
…any many more points beside. That transcript has confirmed to me many of my own suspicions about the inadequacies and defficiencies of the models and the over-inflated confidence placed on the output
Tamsin, whether they are “initialised” projections or not the confidence levels were set against the “projections” being made. Hence the increasing range over time. To be outside the confidence level within 4 years of starting making “projections” and to stay outside for the subsequent 3 years (to date) cannot be a desirable scenario and one that should not, as yet, engender confidence.
Thanks for your reply, Tamsin. However, I wasn’t really talking about communication in relation to this one post. I was talking about communication about AGW in general.
What is your stance on AGW? Do you think it dangerous? Is your aim ultimately to convince sceptics it’s dangerous? I’d be grateful if you could answer that.
Tasmin,
Ok. But why did climate scientists fail to communicate clearly? AR4 Projections of Future Change (policy maker summary) said
(emphasis added)
You are correct in my view that the IPCC was not very clear in the summaries. But this raises a question of trust. Why were they unclear? Goodness, why go so far as to specifically mention the bit about .1C/decade over the next two decades even if all radiative forcing agents were held constant, yet make no mention of the uncertainties involved or the possibility of a pause?
Some might suspect that some IPCC authors or committee heads made this error out of a desire to motivate political action.
I don’t think it’s enough to say, ‘well, we didn’t express that very well.’ If there is a good alternative explanation covering why this was the case, I need to hear it.
[Back in 1990 (FAR), the SPM said “This natural variability could add to, or subtract from, any human-made warming”.
I’ve only been in climate science since 2006. But my reading of it is that there was a perfect storm of:
(a) assuming everyone else would understand this could mean flattish short-term trends;
(b) assuming everyone else would understand that surface temperature is only one part of climate change;
(c) little consideration of the probability of an actual plateau, rather than just reduction in warming trend (in particular, a downward fluctuation of natural variability occurring at the same time as a reduction in natural forcings); and
(d) little consideration of how such a plateau would be interpreted.
— Tamsin]
Tasmin
I appreciate your effort to engender and engage in thoughtful discussion. I do, in this case, have a large quibble with one statement – one that is often put forth by climate scientists.
“Climate model projections have shown periods of cooling of about this length, embedded within longer-term warming, since before this pause happened.”
I don’t know what climate model projections have shown, but I do know that it was only after the stop – not ‘pause’ – in warming over several years that climate scientists began attempting to rationalize and explain away these data. The resulting papers ‘proved’ that a ‘pause’ of ten years could occur in a warming environment. Since when is it good science to ‘prove’ something that has already happened?
The statistical error imbedded in these claims is the application of ‘warming could pause for a decade’ to the occurrence of a pause during the FIRST decade of the century. We’re not talking about a decal-long pause during 100 years – we’re talking about a decade pause during a particular decade – not the same probability.
I’d be impressed if someone could come up with a single reference to a single climate scientist discussing even the possibility of the pause we’ve seen occurring. Is there a single climate science in the world who did so? Please remember, these are the same people who kept denying that there was any ‘pause’ until is went on so long that they were shamed into the ‘we knew it would happen all along’ meme.
[Thanks. Did you follow the link to “since before this pause happened”? The paper is from 1990. In it Figure 10 shows the simulated change in temperature to an instant doubling of CO2 at year 0. While it responds there is a pause/dip in the global average temperature from a hot year (~30), a bit like our 1998 El Nino, until the warming is clear again 10-15 years later. In other words, scientists did discuss exactly this kind of pause well before it happened.
In the present situation we also had a temporary reduction in the overall forcing, which probably explains why the pause has been a bit deeper and longer than in this kind of fixed forcing simulation.
Yes, prediction of exactly when a pause would happen is a different question. The much smaller subset of research called Decadal Prediction is concerned with this, i.e. with trying to predict year-to-year changes. But the vast majority of climate research is on actual “climate” – the statistical properties of weather, not its trajectory – i.e. it attempts to capture the long-term trends. Yes we want to see realistic variability in the simulations, but we don’t attempt to make the bumps and wiggles line up.
Hope that helps! — Tamsin]
“The “fingerprint” of CO2 warming in the models may be clear in the models, but its clearly not detectable in the real world…”
Not detectable in the real world? 2% or so of Greenhouse effect goes to the air (which is the data set you are discussing) while the bulk goes into the oceans ( where rapid increases in temperatures have been detected.
If you claim heat is missing, perhaps you have a suggestion for where it might go. My money is on a new and very worthwhile bypass in Islington.
What was the recent evidence that indicated the pause was only a slowdown?
[Thanks for the Q. Cowtan and Way (2014) used two new methods to interpolate the HadCRUT4 record in regions with no data. Their methods give about 2.5x larger warming trends from 1997-2012 than the original HadCRUT4. One of the methods, kriging, is the same that BEST used for land temperature interpolation. — Tamsin]
Sorry all – 23 comments still in moderation…will get to them as soon as I can
Hi Tasmin,
Re your points:
BP a) one would hope that ‘scientists’ knew that apparent plateaus in temperature could occur because they were already in the record. b) as far as I recall there was never any attempt to indicate that the future would be anything except a constant rise in temperature. You are correct on both points, but I’m not sure of the relevance for understanding the current apparent plateau in temperature anomalies.
DP c) scientists did talk about the ‘pause’ in the media, but all I saw until recently denied its existence and argued that more time was needed to detect any deviation from the warming trend. d) Given the current flurry of papers claiming different reasons for the ‘pause’, I’m sure that it will be interesting determining which ones are ‘correct’.
Re your conclusion, I had to laugh at these sentences in your post:
“We find that being defensive, over-confident or dogmatic are not successful strategies. Humour and humility are useful in keeping people on board and one’s sanity intact.”
If these truths need to be explained to climate scientists, then I think you will have an uphill battle – a Sisyphean one.
[Not sure what BP and DP mean, sorry? Projections for the future are never smooth constant rises. Our mistake was always showing averages of lots of simulations (which looks like a constant rise, because the bumps and wiggles cancel out on average), or smoothed trends (e.g. a running average, specifically to remove the bumps and wiggles and reveal the underlying trend). The recent flurry of papers is fascinating, and I’m sure we will start to have more and more estimates – like attribution studies – attempting to put percentages on each factor. The case seems to be building for tipping the balance a bit more towards variability than forcings, but the forcings are still needed to complete the picture. — Tamsin]
Good point. I suspect Noel Keenlyside’s model adjustments had little influence, because there was no bloody shirt for the media to wave. The ‘pause’ had already been going on for a decade and the defenders of the faith were busy denying there was any problem, so they probably found the study unhelpful. The skeptics expect natural variation to be stronger than anthropogenic and some have been arguing for AMO, PDO etc. for years, so one assumes they found this study unsurprising.
Yes, it is very common, and it is not just odd but tragic that she plays along. In the interview she failed to do what most climate scientists would do — to point out to the interviewer that 1998 isn’t a valid starting point for a trend line since it was an extreme outlier. She steadfastly refuses to deal with the immense intellectual or flat out dishonesty from the s[k]eptics.
[Human brains pick out patterns, so they see a plateau in recent years. I answered questions about that plateau. I also repeated in every interview, I believe, that short-term trends are not what defines climate, only the long-term ones are. This explanation is consistent with other interviews I’ve seen by other climate scientists. — Tamsin]
You would need a flood of climate scientists just on this page alone to deal with the huge number of misstatements and other nonsense flowing from the s[k]eptics. Clearly that isn’t possible … climate scientists are busy doing climate science. The problem is that this is a fundamentally wrong approach that fails to deal with what is actually going on, which is a heavily funded propaganda campaign waged by the fossil fuel industry and its allies. That’s what needs to be addressed.
[Ha, I’m doing my best to be that flood! And yes, I do need to get on with my work…
The existence of funded campaigns does not negate any other source of scepticism. Many of the sceptics I talk to are academics / technical types from other fields — “grumpy physicists”, and I mean that affectionately — who are often more familiar with controlled experiments than natural experiments, more familiar with frequentist statistics than Bayesian, with simple toy models than complex simulators, with their own discipline than interdisciplinarity, and so on. These people ask me good questions about model calibration, or about seemingly inconsistent pieces of evidence, or about errors and over-simplification of results by the media, and I answer them. A second category of sceptics would be the wishful thinkers: of course we would all prefer this not to be true. No money required to motivate either group! — Tamsin]
An injection of heat into the planetary system equivalent to 4 Hiroshima bombs per second continues. There has been no pause. Competent communicators would make this point over and over again … any talk of a pause, when the populace at large doesn’t understand the fundamental process of heat accumulation due to greenhouse gases, is grossly misleading.
[Rather than say “What pause? There’s no pause”, I prefer to explain why some people say there is one (because they mean surface temperature not all of climate change), what evidence there is for/against (changing), how there could physically be a pause in one aspect of climate change and not others (i.e. internal variability), and whether that changes our views on human causes of climate change (given internal variability and the presence of natural cooling forcings, no). I like to think that’s less, not more, misleading… — Tamsin]
Michael Mann criticized Revkin as well. He and Joe Romm are doing a far better job of communicating the facts.
[Everybody criticises everybody… Let’s just say we each have our own emphasis and criteria for what we say. — Tamsin]
The basic CMIP5 models are not good for predicting short-term variability. Yes, we both agree on this. But what does this imply?
When a ‘pause’ , or a downward trend occurs in a model, a corresponding upward trend occurs in a different model. In each instance of a ‘pause’ occurring in a given model, there are opposite (and upward) trends in enough models for it to not show up in the average. This, in turn, is true for all models in the ensemble.
Which is why there are no residual multidecadal trends in the century-scale model average. On the other hand, look at the instrumental global temperature record: http://www.ncdc.noaa.gov/sotc/service/global/global-land-ocean-mntp-anom/201101-201112.png . It shows clear upward and downward trends lasting about 30-40 years.
Tamsin,
Firstly, many thanks for engaging in this way. Your politeness and consideration to others is a breath of fresh air.
As requested, here are some quotes from Dr. Bill Collins: Head of the weather science department at Berkeley – lead author of chapter 9 in the fifth IPCC report.
“Initial Conditions – Page 30:
So, we build climate models. We assume when we construct those models that the net energy balance of the planet was identically zero or effectively zero at the start of industrialization.”
Bob Tisdale who, in many sceptics view, is a first rate analyst on Global Climate systems. He is measured, detailed, analytical, precise in his language and not prone to unscientific prognostications. Bob says that “because Climate Models cannot simulate coupled ocean atmosphere processes that cause global surface temperatures to warm and then stop that warming”. I believe he would say, therefore, that the founding principle on which your models are built (Page 30) is false.
Imagine, just for example, that at your industrialisation start date, (I believe you use 1950 but I’m not sure) you had no way of measuring the amount of heat held below the surface (beneath the surface sensors) in the Pacific Ocean, even in ENSO neutral conditions. Imagine that heat re-appearing via a multidecadal process. What would that do to all your calculations?
I’m reminded of the highly complex models used by the financial community. No one senior at the Banks understood them but they built policy around them.
They didn’t ask the “initial conditions” or “assumptions” questions or, when they did, were completely bamboozled by the technical language and jargon. One assumption was that the rating agencies were impartial; one initial condition was their accurate assessments of risk. But neither was true.
On assumptions, Dr Bill Collins again:
Aerosol Forcings – Page 33
“And our information regarding the concentration of aerosols in the atmosphere becomes quite problematic once you go back more than a few decades. At that point, we are literally relying on high school records. So, the aerosol number in this graph is particularly uncertain.”
Uncertainties in Cloud Behaviour – Page 36
“What we are trying to do, so, what we have, what is done is that we accumulate models from around the world. We do that in order to account for structural uncertainty among the climate models, because there are a number of processes in the climate system we just do not understand from basic physical principles.
For example, let me be careful how I state that exactly. We understand a lot of the physics in its basic form. We don’t understand the emergent behavior that results from it. And so, a good example for that would be cumulus convection. Well, we know, okay, it’s anisotropic turbulence occurring, anisotropic because it’s dealing with a buoyancy gradient. It’s got an internal heat engine fluid in the form of condensation of water vapor. So, it’s nasty, it’s turbulence, it’s anisotropic and it has a heat engine at intervals physics across twelve orders of magnitude. So, it’s a multiphysics problem.”
And just to cap it off, some human error:
Anthropogenic Contribution – Error Bars Page 25:
“The final feature of this is the total anthropogenic, which is a summary of everything above it, has a very large error bar. This is going to come back to haunt us when we talk about the estimate of transient climate response which appeared in your notes because, I’m sorry to say, that error bar was not propagated into that calculation, and it’s a large error bar.”
One would therefore believe that a “re-think” might be in order.
Judith Curry has an excellent post about severe testing of hypotheses backed by this paper: https://www.academia.edu/4423192/Severe_testing_of_climate_change_hypotheses.
Do you have any thoughts on this and the above?
[Thank you for taking the time to do this. I’ve run out of steam today (11pm) and have an all day meeting tomorrow, followed by a new post to go up. But I’ll use this comment as a reference and try to look at the quotes and context more later. Sorry not to give more specific replies. Will aim to at some point though. — Tamsin]
If AGW is correct and serious then there is still a massive job to do in terms of explaining it convincingly to the public. However, even if it turns out to be wrong, there are still huge advantages to investing in renewable energy and reducing fossil fuel dependence. Oil, coal and gas dependence causes wars, unequal power distribution across the world, air pollution and other damage. Renewables could be cheaper, cleaner and more equally owned.
H’mm.
I’m never much impressed by self-assessment in any field. And if the best we can get to is
‘we currently assess that our models are good enough’, then that’s really not very impressive at all. As Feynman pointed out ‘ the easiest person to fool fool is yourself’. Self-assertion is really not good enough.. there needs to be something pre-decided, tangible and demonstrable to those outside the field rather than a smug complacency.
The comment ‘The more things the models successfully reproduce, the greater confidence we have’ that is probably true at the macro level. Few would disagree with Arrhenius’s simple model that if you increase the level of CO2, all other things being equal the temperature will tend to rise.
But at the level some claim the model should be used – detailed specific numeric predictions of future climate states, they fail. The ‘pause/hiatus/stop’ is the most visible sign of this failure – and probably the most important.
At best we can say that some of the models reproduce some of the high level characteristics of the climate system. But it is vastly overstating their skill to say any more.
Or may be we just expect that models that claim to have useful predictive skill should actually be able to predict things?? And when they don’t, we conclude that is a reason reduce our confidence in them.
This doesn’t seem to be a particularly hard point to grasp.
It seems that many commenters on this thread have great difficulty in understanding what climate scientists are telling us: that no climate model has been designed yet to predict what precise surface temperatures will be for given time periods or dates in the future. Rather they’re designed only to predict, in general, likely trends.
If you want models that predict slowdowns and pauses with accuracy, first you will need the means to predict natural events like volcanic eruptions, changes in the sun’s output and variations in ocean oscillations. To be even more accurate you’ll also need to predict what aerosol emissions our activities will produce in future years. Sceptics are demanding standards of accuracy that only apply to models fed with starting positions which are then used to create weather forecasts. And, as we all know, they have difficulty making predictions more than a few weeks ahead.
To use an analogy. Think of it like creating a model to predict likely world records that will be broken at the next Olympics. A model could be created that when fed with the ages and performance data of all current athletes, plus (for instance) details of altitude, humidity and temperature at the next venue, could make a stab at predicting who is likely to break what record and with what improvement in time. However that model would be next to useless in predicting the results at the 2028 Olympics, given that the athletes who will take part then are still young children and the venue is not yet known. However a different model that ignored the names of current individual record holders and instead extrapolated from the rates records are broken in different sports and considered genetic and other factors—that I can’t think of but I’m sure others can speculate—could perhaps make a stab at predicting the likely improvements in race winning times we could expect to see by 2028. So it’s horses for courses (…and I feel another analogy coming on).
The question isn’t is it worth spending *any* money on climate. It probably is.
But is it worth spending the current large amount on it? There was huge splurge of money without much thought of return back in the 1990s and that has continued. But fifteen years on, and in the light of the total failure of clisci to make any societally useful progress in that time, do we need to spend the same amount?
Is it worth spending money on 107 different climate models – none of which are consistently useful? Or on however many research ‘climate scientists’ there are?
When their only work product is papers for other cliscis to read, but nothing at all that helps the wider world, then I’d suggest it isn’t.
Given the pretty dismal record of making any progress in the last thirty years, I’d suggest not.
So, when the accuracy of measurements is at best in tenths temperatures, and often at integers equal to, greater than or less than 1, you claim that differences in the thousands, hundredths or (gasp) averaged tenths of a degree are significant in determining validity?
Excuse me while I laugh, loud and long…
How comforting it is to read how, after enough model runs one can find similar trends to observations.
Is that science?
Seems more like luck. In another blog, someone made a claim about a six-sided die, that one can only determine an average die roll result if the die is rolled for a significantly high number of rolls.
The truth of die rolls is, there is no average roll for a six sided die; every roll will result in an integer 1 through 7.
As an old fossil who has some history of industrial models, here is the ‘back in my day’ comment.
Model runs were not constructed as a complex mass of calculations. They were constructed of simple verified calculations. When two calculations were intertwined, they were verified before moving forward. When new formulations caused errors, the model was immediately returned to original and people who knew their jobs depended on it immediately tore into the removed problem to find where it goes wrong. A lack of success meant in absolute terms, lack of employment.
A major part of that philosophy is because my bosses cared not for errors, let alone errors of major magnitude. (e.g. “Mankind is doomed unless we immediately revert to stone age CO2 output.” paraphrased from too many alarmists).
Serial errors would have sent me packing back to a different, likely lower Peter Principle level occupation.
Yet, GCM model owners are apparently immune from such accuracy insistence, methods and eventual occupation levelers?
Just what is this saying? Let’s simplify somewhat.
Medium confidence; is medium a result of a calculation or just divined?
What is meant by ‘difference’ between models and observations? Seriously! Otherwise this is just PR spin with clouds of doubt.
All right, we understand and accept that the difference is substantial as almost anyone can spot the models don’t match reality.
Now about that variability? Floating, system, local, defined or perhaps random variables?
If CO2 physics is estimated and applied correctly, just exactly what variable is negating or diverting CO2 warmth? Are thunderstorms or any storms allowing heat to escape… Where are the serious science investigations into actual CO2 atmosphere interactions?
If it is proven that CO2 heat is causing oceans to warm a fraction of a kelvin we certainly don’t need to worry as it will take millenniums of CO2 heat to bring ocean abysses up to tepid temperatures and those temperatures are still unable to warm most summer days.
Forcing error?
Misunderstood?
Misapplied?
Unknown forcing?
Or just too advanced for a model that fails the basic CO2 calculation?
Some?
Er, does this mean the actual models that overestimate GHG forcing is unknown? Or more of that climate smoke evading uncomfortable details?
What is the next step, once it is determined that XX models fail the CO2 effects guess? Perhaps defunding the failures would wake up some people who are directly responsible for developing and, shudder, actually using those aberrant models.
Just how long is this period of accuracy good for? Hours, days, week? That is why they run these models repeatedly with new observations entered! The better meteorologists study the model runs, individually and collectively trying to determine the strength and likelihood of interacting weather masses so that they can make an ‘educated’ prediction.
Next, taking the MetO claim that they use the ‘same’ models for weather that they use for climate. Are you claiming that these models that successfully estimate a storm track are basing their weather estimates on CO2 forcing?
There is that ‘some’ word again; this time it is coupled to ‘evidence of improvement’. Is that meaningful to anyone outside of a post model analysis discussion? Those words shouldn’t be used to us commoners as they only mean, oops the model is still wrong frequently.
Oops, I missed a closing ‘>’ at
“…10% for any given month.”…</blockquote"
My mistake, please accept my apologies.
And yet this comment is immediately responded to by a couple who show no understanding of the facts and who insult you and all climate scientists … most of the comments on your blog are of that sort.
As for ” No money required to motivate either group”, you miss the point — the money buys propaganda that feeds those wishful beliefs. One can plot the level of belief in AGW against the influx of money to see the effect. There’s also a sharp rise in disbelief after the CRU emails were stolen and repeatedly misrepresented.
Also … you answer questions, but do the questioners accept them? Over and over I have seen the same people issue the same talking points despite their having been repeatedly refuted.
As I said, other scientists point out that 1998 is an outlier and thus a cherry picked starting point. This isn’t about picking out patterns, it’s about motivated reasoning.
Tamsin
Cowtan & Way isn’t “evidence”.
It’s a piece of mathematical supposition by two amateur climate scientists who were prominent in an activist group where they dreamt up the idea of the paper.
Quote from Kevin Cowtan in the SkS forum (courtesy of Barry Woods):-
“What are you after? If you want to do a HADCRUT3 takedown, that’s what I’m working on at the moment (as a paper, but got some nice analogies for popular usage). It’s arguably better than the BEST argument because it’s global, although I’m not ready for publication yet! But I can give a trivial argument by analogy which shows that HADCRUT3 must be wrong, and give a corrected version in which 2010 beats 1998.”
Does this sound like scientific “evidence”.
[I can’t comment on their motivations, but I can’t recall any criticisms of their analysis yet. As with almost any statistical modelling, opinions will always differ on assumptions and how to treat missing data.
“Takedown” is quite a common phrase for “my work / judgement completely contradicts someone else’s”. I, for example, would call a particularly brutal and thorough peer review, or even conference question, a “takedown”. It doesn’t mean there were any prior motivations to contradict the results.
So from the quote above, and what I know of the paper, I’m not worried.
— Tamsin]
Tamsin
Compliments on your paper and seeking to communicate.
May I encourage you to read the APS transcript – with double spaced short lines its only ~ 100 pgs of typical text. Following some stunning excerpts. Emphasis added.
APS Climate Statement Review – Workshop Transcript
Tamsin
Could the Pacific Ocean Power Stroke identified by Willis Eschenbach be the initiating trigger or synchronizing event for Wyatt & Curry’s Stadium Wave?
Could it be used to synchronize and initiate Global Climate Models to improve their current very poor performance? (ie > 95% outside of evidence)
[Thanks for these links – I haven’t looked at them but have added them to the reading list. Cheers — Tamsin]
Geoff Harris
For a “climate” long duration, compare 34 year CMIP5 projections against temperature reality.
Only 95% out of spec!
[Quite a bit I could say about this but this is last comment in moderation and I have run out steam…. — Tamsin]
mae culpa – The APS quote ends at
“————–
Evidence: . . .”
You work with systematic ensembles of models; AR4 presented results from an “ensemble of opportunity” as if they covered the full range of future climate compatible with a particular emissions scenario and our understanding of the physics and chemistry of climate. Is AR5 any different?
If the sun and volcanos are obvious explanations for the pause now, why weren’t they mentioned as viable explanations when Kerr wrote his article? Now we add a dash of solar dimming, season the stratosphere with a formerly undetectable pinch of aerosol and water vapor, flambe the deep ocean (while reducing the estimate for radiative imbalance?), and frost with vintage 2000’s cold Eastern Pacific (aka unforced variability). Reserve the vintage 1980’s warm Eastern Pacific for the unforced warming on the last page of the Supplementary Material.
Ah, the shell game; claim that responders fail to understand facts, are insulting and then go on to insinuate that most comments on Tamsin’s blog are similar.
Insults? How about facts?
You, mk, are uncouth.
mk, you insult Tamsin, by intimating that others insult her. Perhaps worse, you demean her in a very condescending smug manner. Grow up, be an adult and speak with civility and respect to, Dr. Tamsin Edwards. Dr, Edwards is a humble physicist and is clearly your superior in life and science.
mk you avoid dealing in facts or reality.
In many cases, that answer is clearly yes.
Only that isn’t the answer you are expecting, actually given the way you’ve phrased the question, you are demanding a certain answer.
In your world, yes means we heathen disbelievers in catastrophic AGW immediately repent our sins and surrender our souls to the consensus.
Yes, means we consider Dr. Edwards’ replies and often add her answers to our store of knowledge. To our perspectives, Dr. Edwards considers our questions and replies in kind and treats them as serious conversations of science. A fact appreciated by many.
Perhaps I misunderstand.
Are you claiming that the models do not begin with parameters? No runs of historical numbers?
No growth factors? CO2 for example?
No percentages of negative influences?
…?
Do you also want climate scientists to disagree when a commentator (for example Al Gore, David Suzuki, the entire dtaff of The Guardian, CNN, Michael Mann etc. etc.) makes alarmist claims which are not supported by the science?
I don’t remember any climate scientists criticising An Inconvenient Truth, for example, or the Glacier Melting by 2035 Debacle.
I don’t think many climate scientists would last long if they did (as Judith Curry has almost said, whilst ‘falling on her dagger’).
[Here’s a list of examples of climate scientists countering mispresentations in that way:
http://www.bbc.co.uk/news/science-environment-14969399
http://www.bis.gov.uk/assets/foresight/docs/migration/science-reviews/11-1121-sr3-changing-variability-in-climates-year-to-year.pdf (p17, paragraph 3)
http://storify.com/icey_mark/the-greenland-surface-melt-story (Marcus Brigstocke onwards)
http://sppiblog.org/news/global-warming-and-the-twisting-of-our-childrens-minds
http://autonomousmind.wordpress.com/2011/07/26/two-wrongs-still-dont-make-it-right/
http://doingadvancework.blogspot.co.uk/2012/02/climate-ethics-expert-says-if-activists.html
http://www.carbonbrief.org/blog/2012/08/will-the-uk-have-the-climate-of-madeira-by-2060,-as-costing-the-earth-suggests
http://dotearth.blogs.nytimes.com/2010/01/11/a-call-to-rein-in-climate-hype-cold-or-hot/?_r=0
http://bishophill.squarespace.com/blog/2011/11/9/dangerous-climate-change.html
http://www.bishop-hill.net/blog/2012/12/2/quantifying-uncertainties-in-climate-science.html?currentPage=2 [Dec 3, 2012 at 1:29 PM]
Hope that helps 🙂 — Tamsin ]
The pause is a little more than a simplistic, ‘zero rate of warming’ ..
The Met Office were discussing the ‘pause’ in warming (or slowdown) when the rate was 0.o7 C per decade, which was about a third of what was expected.. ( down from ~0.18C per decade at the end of the 20th century.)
This press release absolute confirms that climate scientists were talking about a slowdown (albit in 2009 )
http://www.metoffice.gov.uk/news/releases/archive/2009/global-warming
One such internal fluctuation over the last decade could have been enough to mask the expected global temperature rise. However, the Met Office’s decadal forecast predicts renewed warming after 2010 with about half of the years to 2015 likely to be warmer globally than the current warmest year on record.
“Commenting on the new study, Vicky Pope, Head of Climate Change Advice at the Met Office said: “Decades like 1999-2008 occur quite frequently in our climate change simulations, but the underlying trend of increasing temperature remains. We cannot be complacent.” – Met Office 2009
And the hiatus, is described in a paper linked in this press release at warming only being 0.07C per decade since 1999 (so NOT a zero rate of warming)
Do global temperature trends over the last Decade falsify climate
predictions
http://www.metoffice.gov.uk/media/pdf/j/j/global_temperatures_09.pdf
But, previously in 2007, we had Met Office press releases, and advice to government (lots of docs, predicting(strongly) 0.3C by 2014 – no caveats about hiatus, or slowdown possibilities then..
web archive August 2007 Met Office press release:
http://web.archive.org/web/20080708230357/http://www.metoffice.gov.uk/corporate/pressoffice/2007/pr20070810.html
The paper includes the Met Office’s prediction for annual global temperature to 2014.
“Over the 10-year period as a whole, climate continues to warm and 2014 is likely to be 0.3 °C warmer than 2004. At least half of the years after 2009 are predicted to exceed the warmest year currently on record
These predictions are very relevant to businesses and policy-makers who will be able to respond to short-term climate change when making decisions today. The next decade is within many people’s understanding and brings home the reality of a changing climate.” -Met Office 2007
Vicky Pope September 2007
http://www.youtube.com/watch?v=WyDmdcPw7Uw
Vicky Pope: “By 2014 we’re predicting it will be 0.3 degrees warmer than 2004, and just to put that into context the warming over the past century and a half has only been 0.7 degrees, globally, there have been bigger changes locally but globally the warming is 0.7 degrees. So 0.3 degrees over the next ten years is pretty significant. And half the years after 2009 are predicted to be hotter than 1998 which was the previous record. So these are very strong statements about what will happen over the next ten years, so again I think this illustrates we can already see signs of climate change but over the next ten years we are expecting to see quite significant changes occurring.” – Vicky Pope
if, hypothetically the rate of warming average at 0.1C per decade for the next few decades.. it will be very much outside of the bottom of model ranges.. Yet policy has been made on these model projections.
saying, it’s not a ‘pause’. Look it’s still warming ( Ie Skeptical Science’s – Cowtan and Way), is a distraction from the much lower rate of warming that we are seeing, falsifying any number of models as running too ‘warm’.
(though it would be amusing if the rate went negative for a decade, albeit only a little bit 😉 )
Tamsin
Are you referring to pauses in the trace in figure 9 of Mannabe et al?
[Ed wrote that line in the original article, but see my reply in this comment about Figure 10, i.e. the anomalies not absolutes. Hopefully that is what Ed meant! What were you going to say about it? — Tamsin]
A provocation, but serious, answer to the question: Can a climate model be invalidated by observations? One possible answer is no:
A climate model (and the greenhouse effect) is put together from a number of modules that apply physics and chemistry validated in the laboratory to the atmosphere, ocean and surface of the planet. No disagreement between climate models and observed climate will overturn those theories. Only reproducible laboratory experiments would do that. Many groups (at least a half-dozen?) have constructed their models completely independently without sharing any of the computer code that implements this well established science and their projections for the planet as a whole are similar. It seems unlikely that major programming errors that effect output in the same way exist in all of them.
Climate models rely upon several dozen or more parameters to describe cloud formation, precipitation and non-radiative heat transfer. This parameters are tuned so that model output is in reasonable agreement with current climate (and potentially with past climate). So, it a model doesn’t agree with observations (such as the recent pause), it can probably be re-tuned so that it does. It seems reasonable to predict that, if the current pause continues until AR6 is written, that the average climate sensitivity predicted by those models will go down. Observations won’t be statistically inconsistent with many projections. In this sense, climate models will evolve and rather than be invalidated.
Climate is chaotic. This means that failure to reproduce any particular observation with a climate model can be attributed to a failure to appropriately initialize the model. Above, Tamsin tell us that the IPCC’s slower-warming short-term projections were initialized differently than their long-term projections. It’s my understanding that CMIP models failed to hindcast regional decadal climate change better than climatology. This didn’t lead (nor should have led) to assertions of invalidation.
Given the initialization problem and the ability to re-tune model parameters, would any modeling group would ever volunteer to make a one- or two-decade projection that would officially decide whether or not their model is valid? If funding authorities ever demanded such a test, modelers would probably use an ensemble of parameters (unlike the projections used in IPCC reports) as well as an ensemble of initializations and the range of projected warming would probably be so wide as to be useless for policymakers.
Hi Tamsin,
First of all, thank you for your comprehensive reply. It is much appreciated, especially as your day is clearly so busy and in the light of your recent challenges due to your painful period. Though I am a man, I can still sympathise, even if I can’t empathise.
I guess the bottom line is that empty vessels (on all sides) make the most noise, in the media at least. It is a shame that the signal/noise ratio in climate discourse isn’t higher, but I appreciate you are doing more than your share to change that. Facts, it turns out, don’t speak for themselves.
Many Thanks,
Mike
(No need to post this publicly, unless you want to)
Thank you Mike, I appreciate that.
(It went straight through moderation, because you’ve been accepted once, but that’s fine 🙂 )
Tamsin
Hi Tasmin – I was responding to your 26 Feb 1:04pm response with ‘Before the pause’ and ‘During the pause’, or BP, DP.
I agree that the use of averages to smooth the lines (which does have the effect of making the temperature rise look inexorable) has turned out to be a mistake, but only because the current plateau demonstrates them to be misleading. Do any of the models actually result in stepwise rises or reversals in temperature anomalies?
Tasmin,
Thanks so much for your response.
Just sort of shoves the problem back a step though, doesn’t it? Why all the incorrect assumptions? Is it an artifact of the process somehow, a lack of diversity in the reviewers? A disregard for the reviewers?
Obviously I don’t expect you to go research the answer for me, I was just elaborating to clarify my question. I appreciate the time you spent already in your response.
Tamsin
You say As with almost any statistical modelling, opinions will always differ on assumptions and how to treat missing data..
So you’re claiming above that a statistically modelled result, including missing data created using debatable “assumptions”, actually constitutes “evidence for a non-zero trend” .
I fear this points to one of the main worries sceptics from other disciplines have about climate science.
The cavalier brandishing of assumptions and hypothetical scenarios as “evidence” simply isn’t permitted in serious science.
“Evidence” is a piece of data which supports a hypothesis.
If you make assumptions about missing data to create hypothetical conclusion, it may be an interesting talking point – but it can never be “evidence”.
Hi Tamsin – can you explain how these models are “useful” if they predicted the halt in warming but cannot explain why?
I’m kind of expecting to discover that effects A, B, and C were balanced in the model by effects D, E, and F and the result was no net increase in temperature.
If the model(s) cannot answer this kind of question then what kind of question can they answer?
The tone of your response, Foxgoose, indicates that you’re working under the assumption that climate scientists start with an agenda and try to rig the results. That might be true of a few, but if you suggest its the majority then that’s a two-bit conspiracy theory.
In a perfect world, if you’re, say, building aircraft or creating new drugs, then you run experiments and come up with hard data as evidence to test your theories and models. But in climate science there isn’t that option: it isn’t possible to undertake a regional, let alone a global, experiment. So if climate scientists didn’t make educated assumptions and decisions as to how to treat missing data then they’d be left with nothing and would just have to say “we don’t know”. I’m sure that would be great from the point of view of those trying to persuade us there’s nothing to worry about, but it wouldn’t be sensible. So they work with what they’ve got and test the models against whatever ‘hard’ evidence they can lay their hands on. It’s the only thing a serious climate scientist can do.
The fact is that the model projections have been pretty good on average. More importantly, they’ve been very useful: http://www.theguardian.com/environment/climate-consensus-97-per-cent/2013/oct/01/ipcc-global-warming-projections-accurate
Tamsin
Thanks for making it this far. I look forward to your “quite a bit I could say”.
The major item appears that GCMs do not address major natural variations. A simplistic phenomenological approach is centennial warming from the Little Ice Age with substantial natural variations plus an anthropogenic contribution to total CO2. When 34 year model projections are so far off actual temperature trends (>2 sigma), where do we start?
PS may you be refreshed and recharged to a new <a href=https://www.google.com/search?q=steam+engine+coal&client=firefox-a&hs=AFz&rls=org.mozilla:en-US:official&channel=sb&tbm=isch&tbo=u&source=univ&sa=X&ei=v_IZU_WlB4XzqQGn8IHIBA&ved=0CEQQsAQ&biw=1280&bih=636"head of steam"
I have a [novice’s?] question about the future modeled pauses you highlighted in particular, and in general about most of the longer swings or “noise” in a given model’s projections: What drives them?
I can understand hindcasting tuned to known ENSO periods and volcanic events (and solar cycles?), but what drives the variability in an individual model’s projection? Do the models include estimated cycles and return periods for decadal oscillations and volcanic activity? Are there other multi-year cycles in the model conditions? And are multi-year variations always the result of assigned conditions (like, say, an assumed ENSO frequency or especially an external input like solar cycles) or can multi-year variations also arise “internally”, naturally, from the physics accounted for in the model? Thank you.
(just to clarify, I do understand that the end result is not assigned. In the “assigned condition” question I mean is the multi-year variability related to projected cycles in input boundary conditions—and the interplay of multiple overlapping cycles—or can multi-year variability also arise just “naturally” in a model?)
I don’t have the expertise to discuss your climate models. It seems to me the models can be improved, and I suppose in 20 years they’ll perform much better.
However, I can point out to an area where I do see a large potential for improvement. This involves the basic inputs you use for those 100 year forecasts. As you know, these models crunch data to estimate future climate conditions. They use green house gas and aerosol concentrations and other data as inputs. But your papers and discussions use this information as received wisdom, and there’s a tendency to plug in what I consider unsupported projections.
For example, lets take methane. I suspect one reason why your models have failed in the past was the aggressive way methane concentration was projected. The projections used for the AR4 report were a joke. Then I noticed the AR5 RCPs had been tricked by allowing methane concentration to rise slowly to later kick up the rate, thus achieving the target forcings which had been specified. Whenever you write a pepper, do your work, run sensitivities or whatever you do seems to take these projections as given delivered wisdoms you can’t question.
But as I mentioned, some (unquantified to me) disconnect between models and reality is caused by these concentration forecasts. I continue to bring this up, and it seems to be ignored. So what gives? Are you so focused on the climatology you forget it’s being pushed around by emissions and if you don’t get the emissions right then you will miss those forecasts no matter how good are those models?
Kudos to Tamsin Edwards and Ed Hawkins for patiently correcting the usual misstatements and misapprehensions and thinly veiled slander from the usual skeptics that have swamped this thread. Climate scientist outreach is good, but I fear you will find that this skeptical crew — comprised of the same names, over and over, commenting on every climate website and blog — is indefatigable, that it does not learn or admit error, and that it will suck up as much time as you give it, and demand more.