No need to worry about Greenland’s waterslides

We’ve had a new study published about the slippery slopes of Greenland. If we’re right they’re not as slippery – and therefore as worrying – as we first thought.
Greenland’s ice sheet is not simply a giant ice cube, inert but for gradual erosion from climate change. It’s a dynamic, shifting landscape, a place of delicate balance between the forces that create ice and those that destroy it. Under its own immense weight, ice flows continuously towards the coasts and is lost whenever icebergs break off into the sea, or when the surface is warm enough to melt or sublimate. Ice is constantly replaced as falling snow compacts, or rain and meltwater freeze. These incomes and outgoings add up to an ice budget that changes with altitude (lower down the air is warmer, so there is more melting), the seasons, and long-term climate change. Future sea level depends on whether or not Greenland can balance its books or stays in the red.
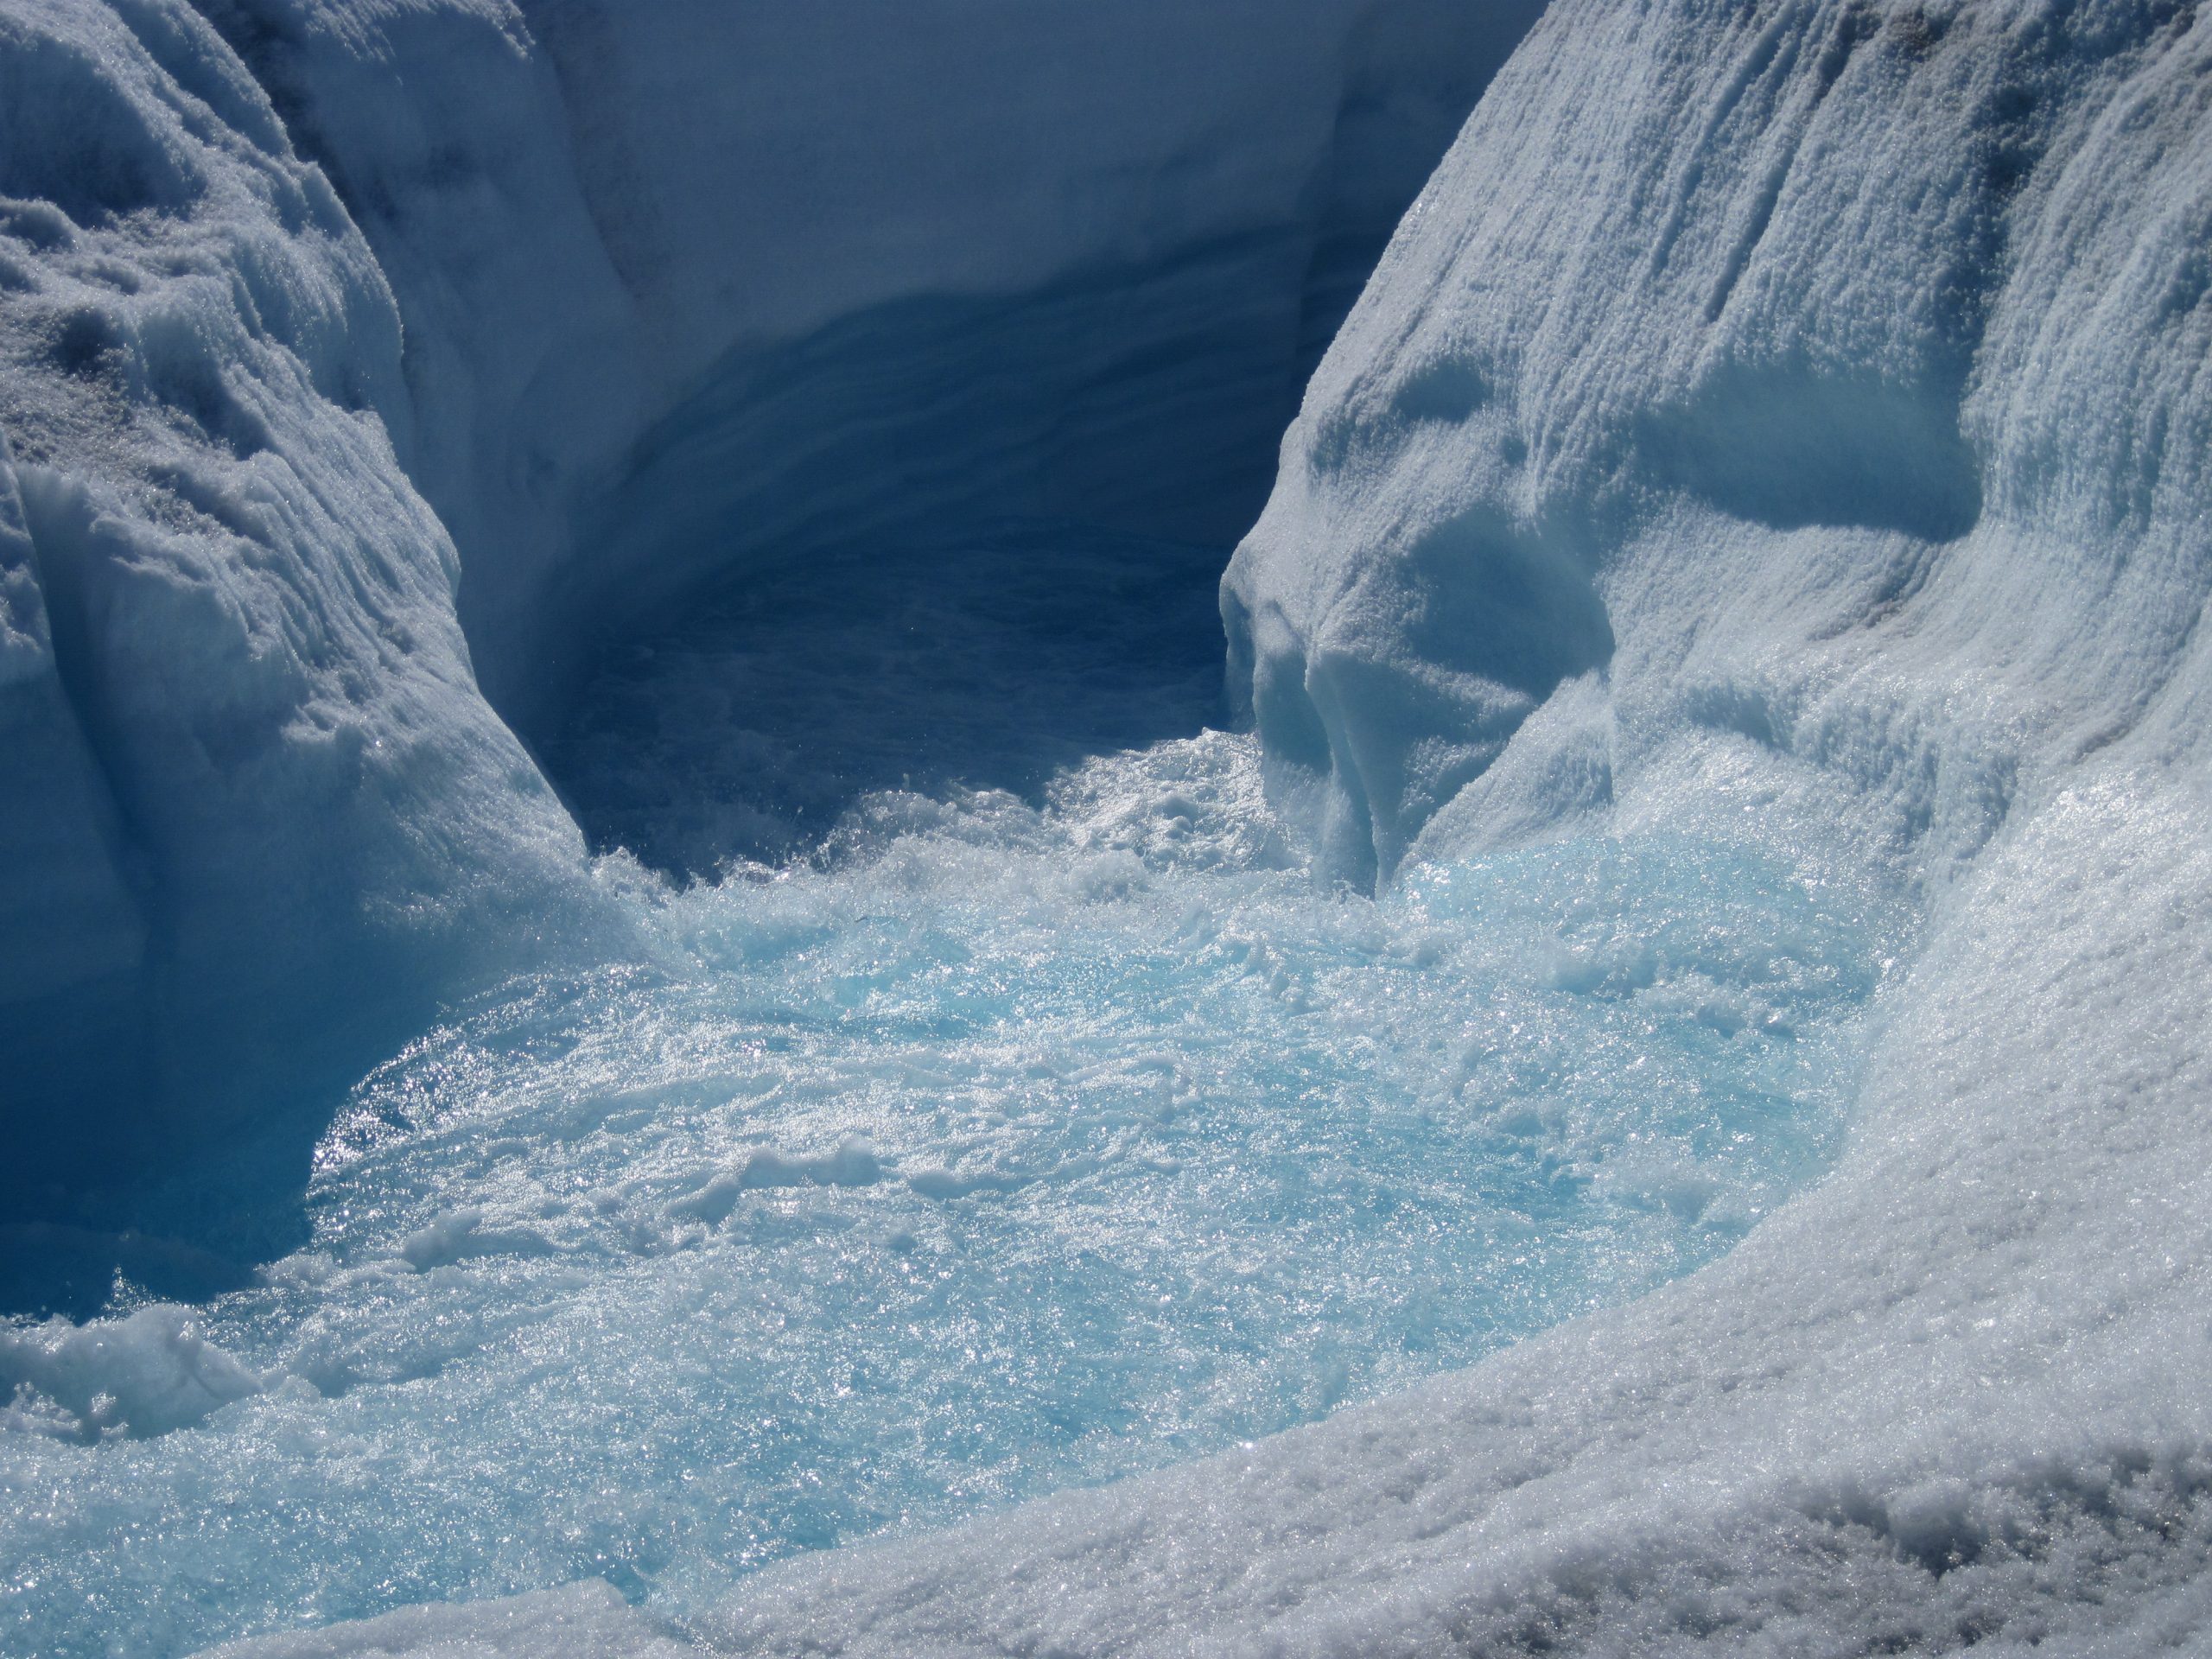
But it’s not only the surface and edges of the ice sheet we need to watch: it’s the bottom too. Ice at the base is under immense pressure from the hundreds of metres of ice above it, which allows it to melt at temperatures below zero degrees Celsius. The meltwater flows out to sea, sandwiched between the ice sheet and the rock on which it sits, creating a waterslide that helps the ice flow more quickly than it would under gravity alone.
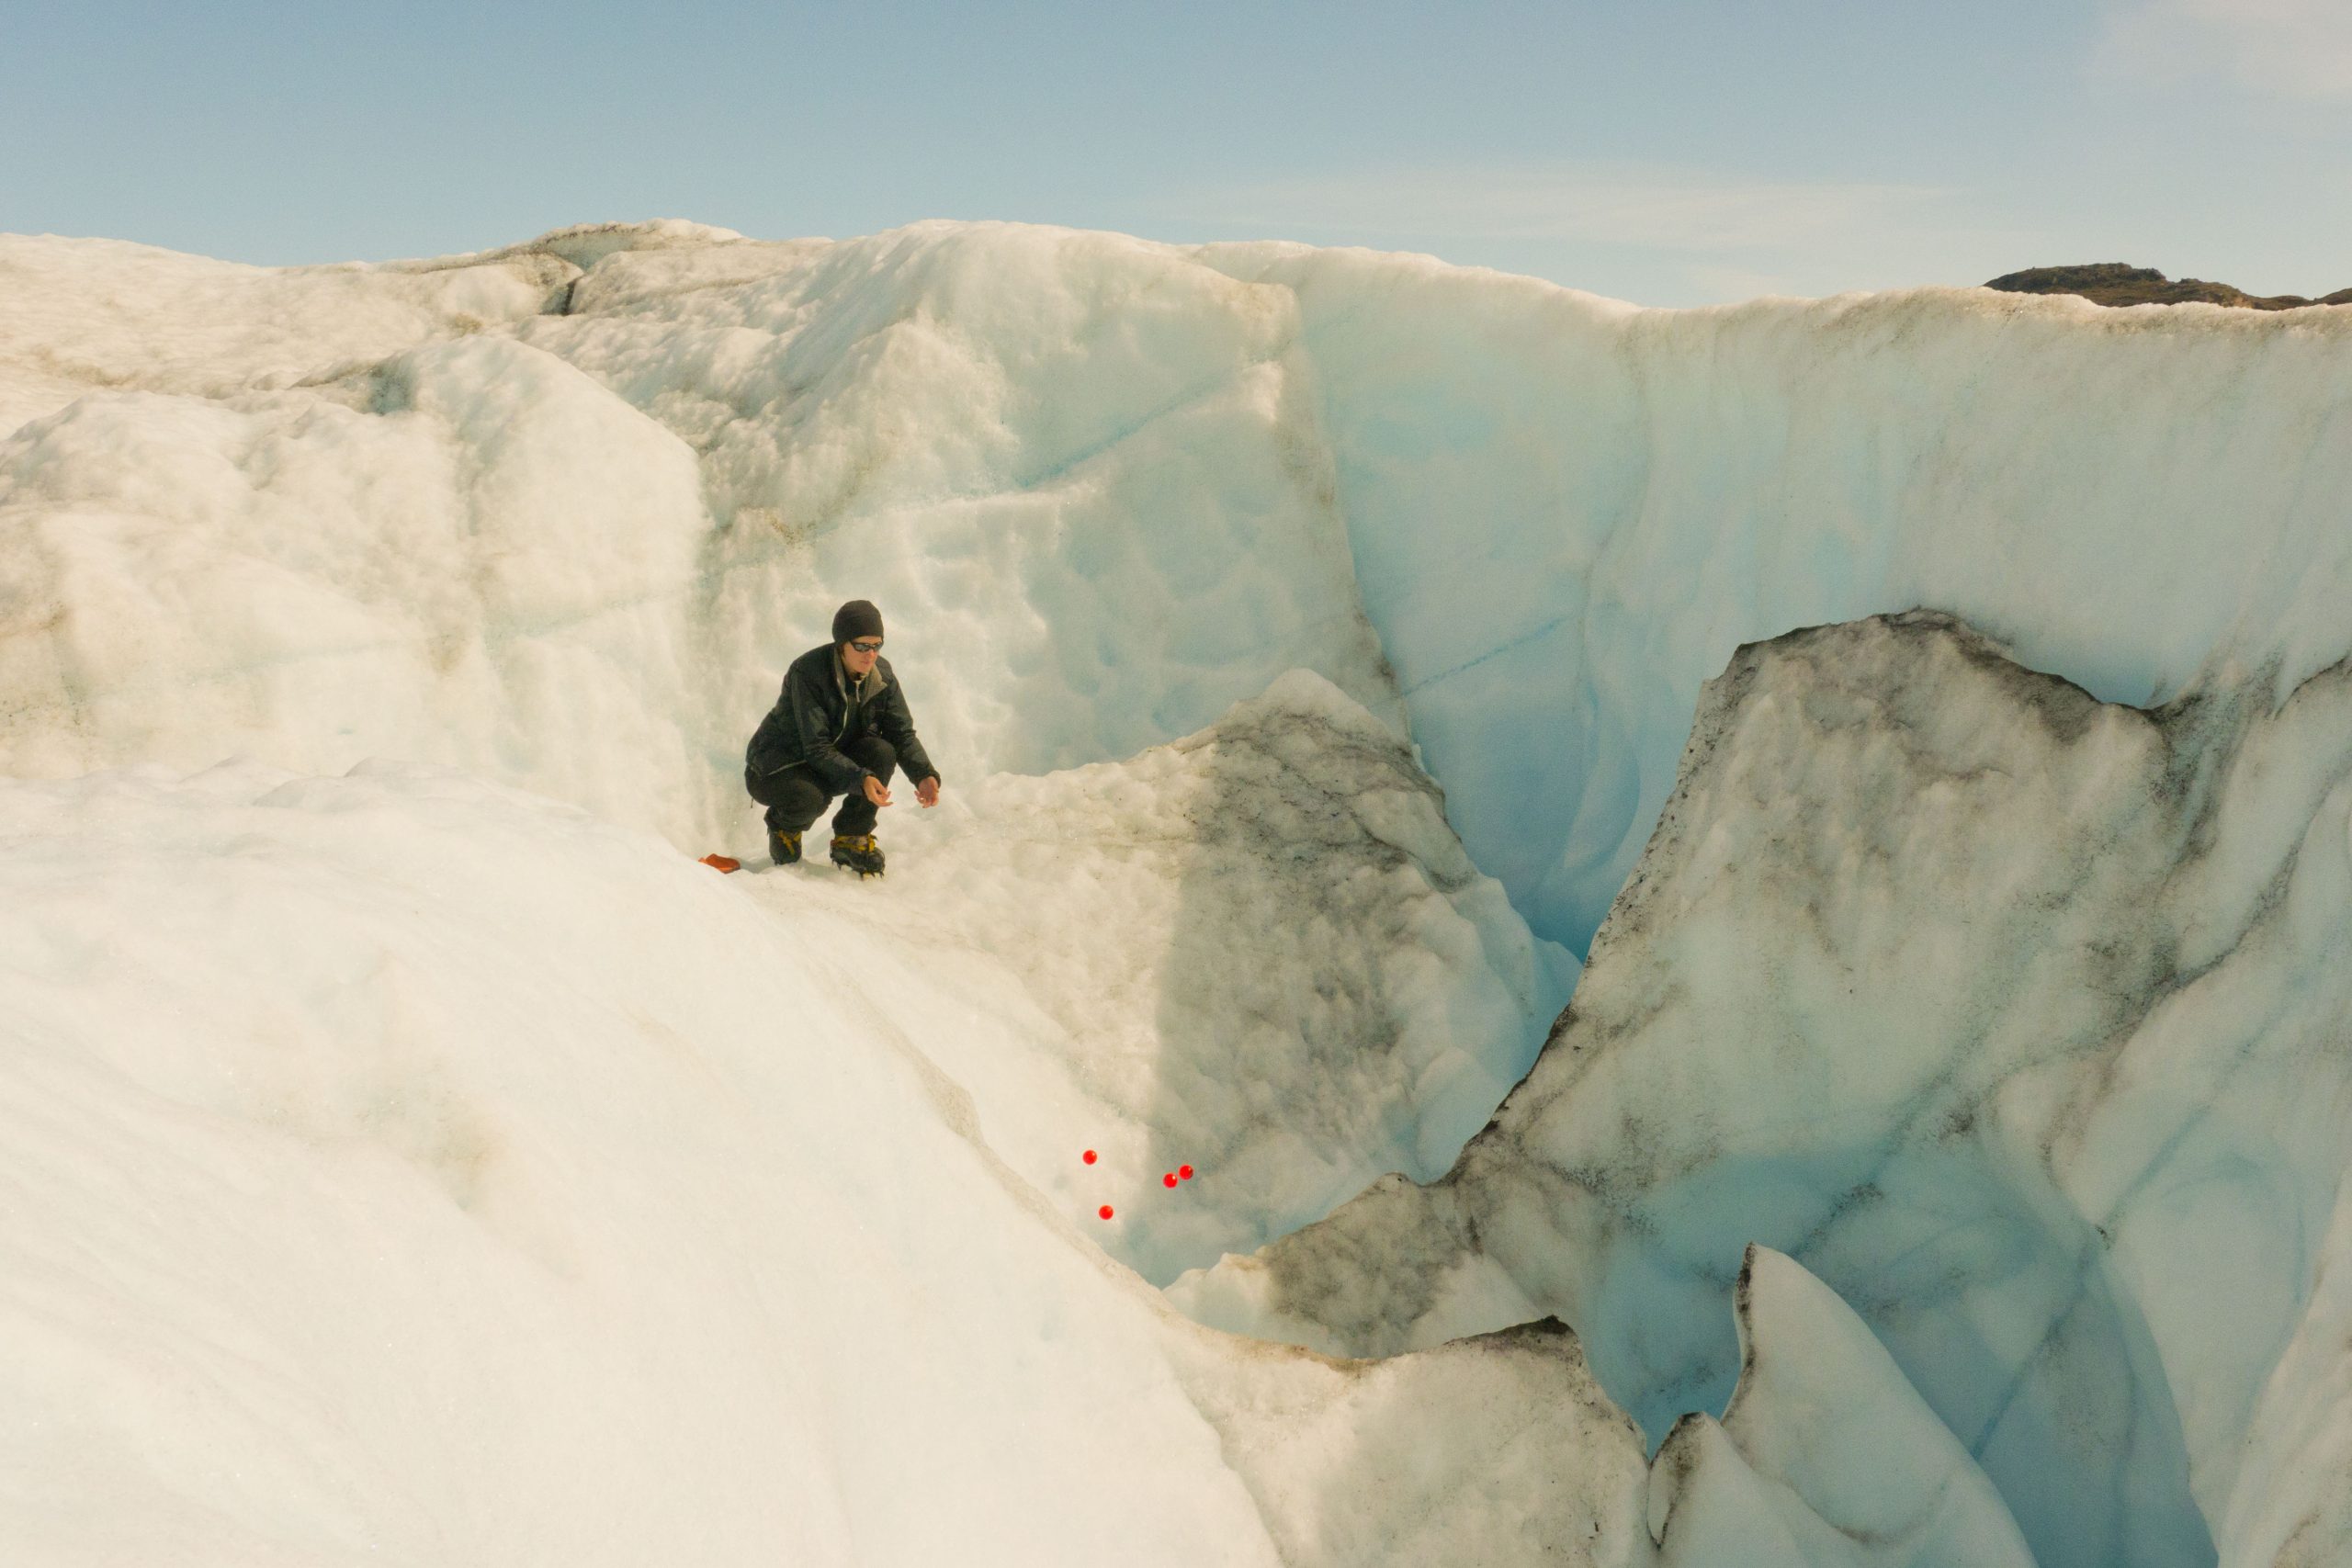
And meltwater on the surface doesn’t behave as we might expect. We call the meltwater that hasn’t refrozen ‘runoff’, but it doesn’t simply run downhill like water off a duck’s back. Most of it carves paths straight down through the ice, helped by crevasses on the surface. In the height of summer these ‘moulins’ become dangerous chutes of fast flowing water. The water reaches the bottom and adds to the waterslide effect. It’s been known since the 1970s that ice in mountain glaciers and parts of Greenland speeds up during the summer melt season.
Ten years ago, Jay Zwally and others put forward an idea that had profound implications for sea level. They suggested acceleration of the waterslide – ‘enhanced basal lubrication’, a.k.a. the ‘Zwally effect’ – could be an alarming mechanism for rapid sea level rise. As the climate warmed, the melting would increase, and the ice would speed up towards the coast. Ice would then be lost more quickly, not only by creating more icebergs, but also by melting more rapidly at these lower altitudes. The extra meltwater would feed the cycle, resulting in faster and faster ice loss.
We’re the first to test this idea using models of the Greenland ice sheet, comparing the effect on sea level with the usual baseline projections that don’t include the Zwally effect. What we found surprised us – it made very little difference. Even in our worst case scenario, enhanced basal lubrication by surface meltwater added only 8mm to sea level over two hundred years, less than five percent of the baseline sea level rise. In some of our tests, it even reduced it.
Our study has three parts: finding out how ice speed is affected by surface meltwater using observations, predicting climate change and its effect on surface melting using climate models, and predicting how these would affect ice flow and sea level using ice sheet models.
A speed limit for ice
Does ice speed up indefinitely as melting increases, or is there a natural speed limit? We’d like to measure this relationship in many different places and over many years, but unfortunately we only have ice speed observations for a single place (11 sites, along a line perpendicular to the coast in southwestern Greenland) and a few years (4 sites 2006-2010; 7 sites 2009-2010):
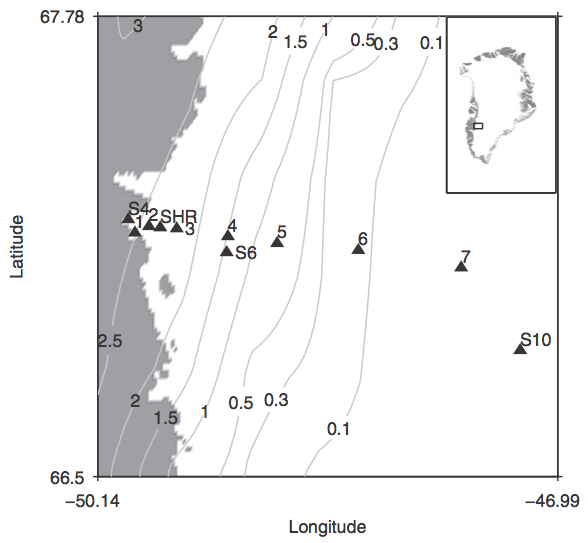
And not all of these have observations of runoff. So because we don’t have complete data, and because we want to make predictions with a climate model, we actually quantify how ice speed in the real world relates to runoff in the climate model. GPS receivers are left in the ice all year to measure ice speed. We convert this to “speed-up”: the ratio of the average speed throughout the year to the lower, winter speed. The faster ice moves in the summer relative to winter, the larger the speed-up. The meltwater runoff is simulated with the “MAR” regional climate model (covering only the area over Greenland, so that we could use higher resolution). Here is measured speed-up (vertical axis) plotted against simulated runoff (horizontal axis):
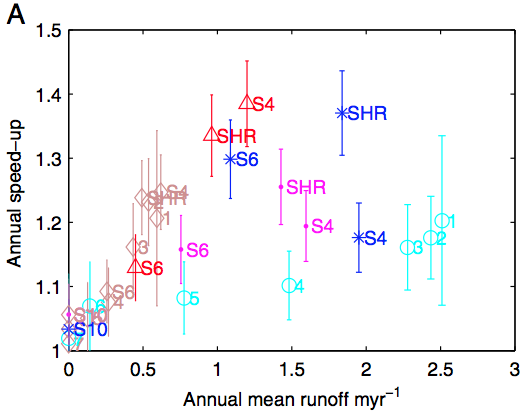
On the left-hand side there is a fairly straightforward relationship: more runoff means more speed-up. But past a certain point things are not so clear. Does the speed-up plateau, or even decrease? And either case, does this actually mean the Zwally effect is self-limiting? Clearly we don’t have enough data to make definitive statements.
So we make the loosest, most flexible statements we can. The graph below – sorry for the typos and watermark – shows the huge range of possibilities we consider. In the worst case scenario (“Max”), speed-up keeps increasing with runoff. But in the best case scenario (“Min”), it declines.
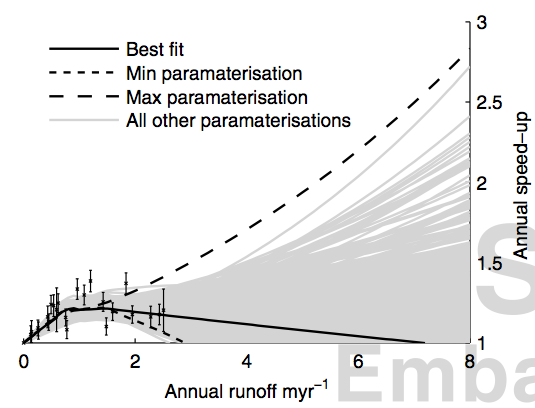
Zwally was concerned about something like the worst case scenario, where more meltwater always means faster ice. But how realistic is the best case scenario? Could the lubrication effect actually decrease with more meltwater?
Recently both observations and theory have indeed supported this kind of decline. It involves a massive change in plumbing. When there is not much runoff, the water forces its way to the coast through an inefficient web of pockets (‘cavities’) linked by narrow channels. This creates high water pressure, lifting the ice from the rock below it and making it slide. When runoff increases past a critical threshold, the extra water carves wide pipes (‘channels’) through the ice which are much more efficient at flushing the water out to sea. The water pressure drops: the waterslide slows down.
The important point about our study is that we do not assume either is more likely. We simply predict both their effects on sea level.
Runaway runoff?
We predict changes in climate and meltwater runoff for the SRES A1B emissions scenario using the same regional climate model as above (MAR), which takes inputs from a global climate model (ECHAM5). The prediction is about a tripling of the amount and area of meltwater runoff between 2000 and 2100. If the Zwally effect were important, we might expect such a large increase in runoff to lead to a large speed-up and therefore a large sea level rise.
Future ice flow and sea level
We use the climate change and runoff, and our relationship between runoff and speed-up, as inputs to four different models of the Greenland ice sheet, to predict changes in ice flow and sea level. (We want to make projections over two hundred years, so we assume runoff is constant from the year 2100 to 2200.) Across the board, the effects are very small.
The baseline sea level rise between 2000 and 2200 ranges from 163mm to 173mm for the four ice sheet models. Enhanced basal lubrication adds just 4-8mm to sea level in the worst case scenario, and between a 1mm rise and a 1mm lowering (relative to the baseline) in the best case scenario. We test this with another global climate model, and another emissions scenario, but the largest effect is always less than five percent.
Why so small? No matter whether we use the best or worst case scenario, enhanced basal lubrication mainly changes the ice speed and distribution, rather than the amount lost to sea.
The ice speeds up inland, which makes it thinner. This could make it more vulnerable to melting, through the lower altitude. But we found the increase in melting was small, and in any case was compensated by the ice thickening at the edge from the faster flow.
In the best case scenario the ice is slower at the edge relative to the baseline, because of the decline in speed-up at higher runoff. This can mean that less ice is lost at the coast, so the sea level contribution is smaller: but the thicker ice at the edge partly, or totally, compensates, depending on the ice sheet model. This is why the best case scenario can either lower or raise sea level relative to the baseline.
In the worst case scenario, the ice is faster everywhere. But the effect on sea level is still small relative to the baseline sea level rise.
This is the first attempt to study whether meltwater lubrication of Greenland’s waterslides is important to future sea level. We find it is not. Instead we should focus on understanding changes in melting and snowfall and (to a lesser extent) icebergs.
Update (13th Aug): Ruth Mottram points out it might be better named the Iken effect after the first person to discover the link between ice speed and the water pressure underneath, Almut Iken.
This post was already too long. I just want to add that there are lots of caveats to this work, several of which I mentioned, and many better ways to do it, none of which are yet possible (lack of observations or modelling capacity). So it’s a first attempt. But we feel it is pretty emphatic.
Press release here
Long is fine as long as it is good, and this is. Nice job.
Thank you.
Good morning, Tamsin. Nicely laid-out article, and thank you for writing it.
Question, if I may: You spoke of both observation and theory. I was just wondering, was there much of a shift in the theory, as observations proved out one way or the other? (Realizing your own caveats, of course)
And
Having never heard much good when it comes to computer models, how did this one fare against available observations?
“The baseline sea level rise between 2000 and 2200 ranges from 163mm to 173mm for the four ice sheet models. ”
Hi Tamsin,
Is this the rise disregarding the steric level change and global ice runoff?
Nice write-up, very clear otherwise.
I should probably read the article, especially as I have never worked on ice, but may I ask what the colors represent in the second last figure of annual speed-up against annual run-off?
If you consider all data, you see a saturation, but for every color individually, there is no sign of any saturation. From the figure, it looks as if the “saturation” is just an artifact of combining different datasets with a different behavior.
A second question, are the results sensitive to the assumption that the runoff suddenly does not increase any more after 2100? Would another tripling of the runoff also be possible and would that influence the annual speed-up?
Thank you for the very interesting post. It led me to wonder what the physics of ice is at the kind of pressures found “way down”. Is there a depth at which all the varieties of glacial ice microstructure converge to a single type, and does the “type” affect the ability of water to “float” the ice? (I’m referring to various types of snowpack / icepack.) Is there someone who is considered an authority on this?
Thanks.
A few more caveats would have been nice. It looks like all of your sites are arranged to that ice flowing from one site piles up at the next lower site, unless that site is moving faster, which steepens the slope, speeding up the flow, etc. Did your model attempt to take these factors into consideration?
In the Antarctic, ice flows into the ocean in many place even though surface melting appears to be negligible. That would imply that your model doesn’t necessarily need to go through (0,0), ie zero melting produces zero flow.
Less than six months later:
Greenland’s hidden meltwater lakes store up trouble
Interesting times for ice modelers.
Sorry, 18 months. Time flies, but point remains.