It’s a Mad, Mad, Mad, Mad, but Predictable World: Scaling the Patterns of Ancient Urban Growth

With more than 7.1 billion people living across the globe, cities house more than 50% of the world’s population. The United Nations Population Fund projects that by 2030 more than 5 billion people will live in cities across the world. The Global Heath Observatory, a program run by the World Health Organization, predicts that by 2050, 7 out of 10 people will live in cities, compared to 2 of 10 just 100 years ago.
Recently, researchers developed what is called “urban scaling theory” to mathematically explain how modern cities behave in predictable ways, despite their unprecedented growth. Recent work in urban scaling research considers cities “social reactors”. In other words, the bigger the city, the more people and more opportunity for social interaction. Think for a moment about the social interactions that occur just on the block outside of your local coffee shop; now multiply those interactions by millions. Cities magnify the number of interactions, increasing both social and economic productivity and, ultimately, encouraging their own growth.
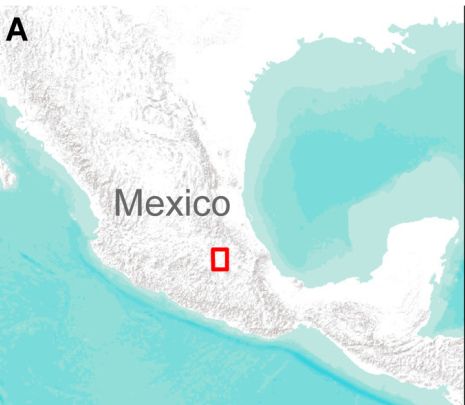
The authors of a recent PLOS ONE paper sought to determine whether ancient cities “behaved” in predictable patterns similar to their modern counterparts. To do so, they developed mathematical models and tested them on archaeological settlements across the Pre-Hispanic Basin of Mexico (BOM, approximated by the red square in the figure below). Based on their findings, they suggest that the principles of settlement organization, which dictate city growth, were very much the same then as they are now, and may be consistent over time.
To test their predictions, the researchers analyzed archaeological data from over 1,500 sites in the BOM, previously surveyed in the 60s and 70s by researchers from the University of Michigan and Penn State.
Using low-altitude aerial photographs and primary survey reports from the original surveyors, the researchers organized the following data from approximately 4,000 sites: the settled area, the average density of potsherds—broken pieces of ceramic material—within it, the count and total surface area of domestic architectural mounds, the settlement type, the estimated population, and the time period.
The researchers were interested in examining areas of the BOM that enabled social interaction between residents, so they excluded site types that did not allow social interaction, for example, isolated ceremonial centers, quarries, and salt mounds. They then grouped the remaining 1,500 sites into both chronological groups and size groups. For chronological grouping, each site was assigned to one of four time periods: the Formative period (1150 B.C.E.–150 B.C.E.), the Classic period (150 B.C.E.–650 C.E.), the Toltec period (650–1200 C.E.), and the Aztec period (1200-1519 C.E.). By the Aztec period, the area had developed from amorphous rural settlements to booming metropolises comprising over 200,000 people.
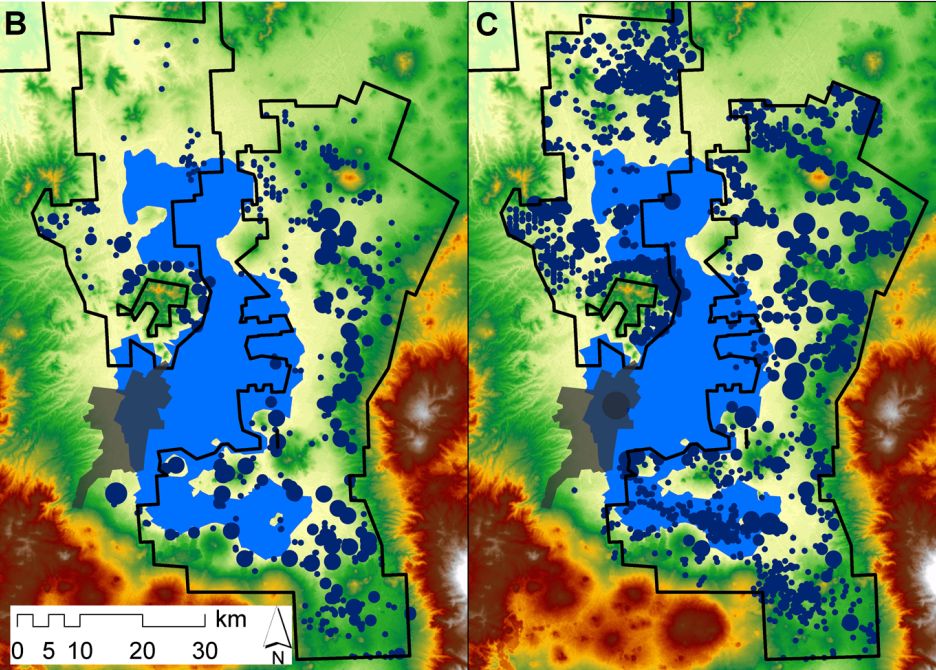
For site grouping, settlements greater than 5,000 people were categorized differently than smaller settlements. In the figure above, panel B denotes settlements dating to the Formative period (1150 B.C.E.–150 B.C.E.), and panel C, settlements dating to the Aztec period (1200-1519 C.E.).
After separating the data into both chronological groups and size groups, the researchers applied their mathematical models and tested their predictions about urban growth in the settlements of the BOM. One aspect of city development assessed by the researchers was the evolution of defined networks of roads and canals in growing cities. Because roads act as conduits, directly influencing social interaction—much like the roads leading to the aforementioned coffee shop—growing cities develop increasingly defined networks to connect social hubs to one another.
Take, for example, the figure below, which displays both a city in an early stage (panel A) and later (panel B) of growth:

Panel A shows the early, or Amorphous Settlement Model, displaying a small settlement easily accessible to the individual via walking, and thus negating the necessity for clearly defined networks of roads. Panel B, on the other hand, shows the Networked Settlement Model, an infrastructure-dense area where networks are clearly defined to accommodate the increased size of the city and density of the residents. Larger cities analyzed by the authors, like Teotihuacan of the Classic period and Tenochtitlán of the Aztec period, epitomize the Networked Settlement Model with its organized network of roads and canals. The findings from the BOM echo the earlier-stated notion that, like their modern counterparts, ancient cities may have acted as “social reactors”, in part by facilitating an increasingly defined network of roads, themselves directly influencing the ability of residents to socially interact.
Scientists use urban scaling theory to show that population and social phenomena follow distinct, mathematical patterns over time. By developing mathematical models to predict measurable changes in city growth, these researchers applied the same patterns to ancient cities and concluded that the development of settlements over time in the BOM seem analogous to those observed in modern cities. Researchers predict that the same mathematical models could be reformatted to estimate population size of ancient cities, as well as to develop measures for calculating socio-economic output like the production of art and public monuments based on the relationship between settlement size and division of labor. Although there is still much to be solved through the equations of urban scaling theory, the consistency of city growth over time has implications for both the past and the present.
Citation: Ortman SG, Cabaniss AHF, Sturm JO, Bettencourt LMA (2014) The Pre-History of Urban Scaling. PLoS ONE 9(2): e87902. doi:10.1371/journal.pone.0087902
Image 1: Auroras Over North America as Seen From Space by the NASA Goddard Space Flight Center
Image 2: doi:10.1371/journal.pone.0087902
Image 3: doi:10.1371/journal.pone.0087902
Image 4: doi:10.1371/journal.pone.0087902