iGEM REPORT: MC Yeast: Stress-based detection and enzymatic degradation of the cyanobacterial toxin microcystin
Note: This iGEM Report was submitted to the PLOS iGEM Realtime Peer Review Jamboree, and has not undergone formal peer review by any of the PLOS journals. We welcome your comments on this work.
MC Yeast: Stress-based detection and enzymatic degradation of the cyanobacterial toxin microcystin
Emilia Broman (1), Hele Haapaniemi (2), Saara Hiltunen (1), Rashad Ismayilzada (3), Antti Koistinen (2), Laura Laiho (4), Nidia Obscura (5), Pihla Savola (2), Snehadri Sinha (4) *, Jami Valorinta (5), Markus Linder (2), Heli Viskari (2)
- School of Electrical Engineering, Aalto University, Espoo, Finland
- School of Chemical Technology, Aalto University, Espoo, Finland
- School of Science, Aalto University, Espoo, Finland
- Faculty of Biological and Environmental Sciences, University of Helsinki, Helsinki, Finland
- Faculty of Science, University of Helsinki, Helsinki, Finland
*Corresponding author: Snehadri Sinha (snehadri.sinha@helsinki.fi)
Author Contributions
Conceptualization: EB HH SH RI AK LL NO PS SS JV
Funding acquisition: EB SH RI
Investigation: HH AK LL NO PS SS JV
Supervision: ML HV
Visualization: EB SH PS LL
Writing – original draft: LL PS SS
Writing – review & editing: LL NO PS SS JV
Abstract
Cyanobacteria, also known as blue-green algae, are an annual problem in many water systems worldwide. During the summer, the cyanobacteria release hepatotoxins called microcystins which pose health risks to humans and animals. Our goal was to build a two-part system to detect and then degrade these toxins.
We based our detection system on the natural oxidative stress response of the yeast Saccharomyces cerevisiae. Exposure to microcystins is linked to higher levels of oxidative stress, and we coupled the oxidative stress response to the expression of yellow fluorescent protein. Thus, fluorescence levels are expected to indicate the amount of microcystins present in a sample. To understand and validate our toxin detection mechanism, we also created mathematical and molecular models. To degrade the detected toxins, we expressed the enzyme microcystinase, which is naturally found in some Gram-negative bacteria. The enzyme renders microcystins 160 times less toxic by linearizing their structure.
Our results indicated that coupling promoter regions of genes involved in oxidative stress to reporters molecules could be used to measure the amount of stress factors in yeast cells. We were able to show that the promoters we chose are a part of the yeast’s rapid stress response, which means they were a good choice for experiments such as this. In addition, we demonstrated that active microcystinase can be produced in Saccharomyces cerevisiae.
Financial Disclosure
Academic sources of funding include Aalto University’s School of Chemical Engineering, School of Science, School of Electrical Engineering, School of Engineering, and the HYBER Centre of Excellence, and also the University of Helsinki and its Faculty of Agriculture and Forestry, Faculty of Biological and Environmental Science, Faculty of Science, and Biocentrum Helsinki. Individual grants were received from Aleksander ja Lucie Lampénin rahasto (PS, AK), Oiva Allan Pölkkysen rahasto (HH) and Tekniska Föreningen i Finland rf (EB).
Funding and support was also provided by Algol Oy, CA Flowdock, IDT (Integrated DNA Technologies) Inc., Kemianteollisuus ry, LAL ry, Thermo Fisher Scientific Oy, Teollisuuden Vesi Oy, Geneious (Biomatters Ltd.), and Veikko Laine Oy.
The funders had no role in study design, data collection and analysis, decision to publish, or preparation of the manuscript.
Competing Interests
The authors have declared that no competing interests exist.
Data Availability
All data are fully available without restriction.
More detailed descriptions of experiments, results and conclusions can be found at our iGEM wiki page: http://2016.igem.org/Team:Aalto-Helsinki. Protocols are available at www.protocols.io/groups/aaltohelsinki-2016.
Introduction
Cyanobacteria, also known as blue green algae, produce harmful algal blooms in water bodies. These blooms become enhanced with greater levels of eutrophication and warmer temperatures [1] and release toxins that pose serious health risks to humans and animals worldwide. The risks are greater in areas where humans and animals have a greater dependency on natural sources of water and are thus are directly exposed to the toxic water. In Finnish culture it is traditional to spend summers at a summer cottage in the countryside and engage in recreational activities that make use of lakewater, for example swimming and sauna. The presence of cyanotoxins in the water restricts such activities and also limits the water sources accessible to humans and animals. Cyanobacterial blooms and toxins are a significant nuisance in Finland, with annual occurrences of related deaths and illnesses. This problem also applies to other countries in the Baltics [2]. In Finland, there is a lot of dependence on state monitoring systems to get information on lake pollution, and it is not possible to receive this information for each and every lake. Currently, there are no commercial methods for detecting or degrading cyanotoxins in waters. A confirmatory paper-based test device for cyanobacterial toxins was recently developed by the VTT Technical Research Centre of Finland and the University of Turku, but is yet to be commercialized [3].
The most common class of cyanotoxins is the microcystins (MCs), which are potentially lethal for liver cells. Microcystins are cyclic peptides that consist of seven amino acids. They contain a unique β-amino acid Adda, and two of the seven amino acids vary between different variants of microcystin. Due to the variation in these two amino acids, more than a hundred different variants of microcystin are known. The most common variant is microcystin-LR (MC-LR), where the variable amino acids are leucine and arginine. It is also the most potent of all microcystins [4].
When MC enters mammalian liver cells, it inhibits protein phosphatases 1 and 2a (PP1 and PP2a). This results in the hyperphosphorylation of target proteins, which in turn leads to the formation of reactive oxygen species and finally to an oxidative stress response [5]. Additionally, MC-LR has carcinogenic effects on the testes in rats [6] and is known to disturb the balance of gut microflora in mice [7].
In yeast, two important transcription factors activated by oxidative stress are Skn7p and Yap1p. They have specific binding sites in the promoter areas of genes that respond to oxidative stress. Skn7p binds to OSRE (oxidative stress response element) and Yap1p binds to YRE (Yap1p response element). Some of the best characterized promoter regions that these transcription factors bind to are the promoters for the genes TSA1 (thioredoxin peroxidase) and CCP1 (mitochondrial cytochrome-c peroxidase) [8]. To construct a sensor for oxidative stress caused by microcystin, we fused these promoter regions with the protein coding sequence of the yellow fluorescent protein Venus.
An important prerequisite for the function of these stress promoters is that the toxin must be imported into the cell. MC-LR is unable to pass the cell membrane without the help of specific transporter proteins. In human liver cells, the membrane bound protein OATP (organic anion transport peptide) has been identified to import MCs into the cell. A previous study found that the QDR2 transporter from S. cerevisiae strain VL3 had the most similarity to OATP out of all S. cerevisiae proteins, and confirmed that strain VL3 was thus capable of microcystin import [9]. To enable the induction of the oxidative stress promoters with microcystin, we replaced the original QDR2 transporter of our working S. cerevisiae strain (SS328-leu) with the VL3 variant of the QDR2 transporter. This was presumed to allow toxin import in the new strain, and thus enable the function of our yeast cells as a sensor.
Microcystinase (MlrA) belongs to a set of enzymes that degrade microcystins and was originally found in some Gram-negative bacteria. MlrA hydrolyzes the peptide bond between the Adda and arginine amino acids in microcystin-LR (MC-LR), thus linearizing the toxin. [10] This linearization renders MC-LR 160 times less toxic [11]. A previous study has indicated that MlrA might be a membrane protein [12]. In addition, we created a homology model of MlrA that further supported this theory [13]. However, MlrA has previously been produced in an active, soluble form in Escherichia coli [14]. We produced MlrA in S. cerevisiae to further investigate the potential of heterologously produced microcystinase to be used for degrading microcystin. Additionally, our goal was to find further information on whether MlrA truly was a membrane protein.
This project explored the possibility of developing a yeast-based system that is capable of detecting and degrading carrying out both of these functions in an efficient and affordable manner. The yeast Saccharomyces cerevisiae was engineered to be able to detect and degrade the most common microcystin, MC-LR.
Materials and Methods
Basic Methodology
Detailed protocols for experimental work can be found at [15]. A summary of the main experimental methods can be found below. Unless otherwise mentioned, S. cerevisiae was grown at 30 °C, and E. coli at 37 °C, with orbital shaking between 220-250 rpm. S. cerevisiae strains containing plasmids were grown in SD medium containing all amino acids except leucine, which was used for auxotrophic selection. S. cerevisiae strains with no plasmids were grown in YPD medium. E. coli with plasmids was grown in antibiotic-supplemented LB medium.
Plasmids and Strains
Escherichia coli strain TOP10 was used for cloning work, and strain BL21(DE3) for protein expression in E. coli. For work with Saccharomyces cerevisiae, strain SS328-leu was used. Protein expressed in E. coli was expressed in the pET28a plasmid. Yeast constructs for plasmid expression were cloned into the pRS415 vector (GenBank accession number U03449.1). For the stress promoter constructs, the Venus yellow fluorescent protein gene was fused with three different yeast promoters in the pRS415 vector. (SGD ID/Sachharomyces Genome Database: TSA1: S000004490; CCP1: S000001774; GPD1: S000002180). pUG6 was used as a shuttle vector for integrating genes into the S. cerevisiae genome; the QDR2 gene from S. cerevisiae strain VL3 was fused C-terminally to a strep tag and used to replace the native QDR2 coding sequence (QDR2 SGD ID: S000001383). MlrA constructs were cloned downstream of a S. cerevisiae GAL1 promoter (GAL1 SGD ID: S000000224). MlrA from Sphingomonas sp. ACM-3962 (GenBank accession number AF411068.2) was used fused C-terminally to a 6x His-tag, with codon optimization done by GeneArt.
MlrA enzyme genes were synthesized and cloned into target vectors by GeneArt; all other genes were synthesized by IDT and cloned into target vectors either with Gibson assembly, yeast recombination cloning, or restriction enzyme cloning.
The following BioBricks were produced: Venus Yellow Fluorescent Protein for S. cerevisiae (BBa_K1907000), Microcystinase (MlrA) for S. cerevisiae (BBa_K1907001), Microcystinase (MlrA) for E. coli (BBa_K1907002), CTT1 promoter for S. cerevisiae (BBa_K1907003), TSA1 promoter for S. cerevisiae (BBa_K1907004), CCP1 promoter for S. cerevisiae (BBa_K1907005), Microcystinase (Mlra) + mating factor alpha tag for S. cerevisiae (BBa_K1907006), TSA1 promoter + Venus YFP for S. cerevisiae (BBa_K1907007), CCP1 promoter + Venus YFP for S. cerevisiae (BBa_K1907008), CTT1 promoter + Venus YFP for S. cerevisiae (BBa_K1907009).
Fluorescence Assays
Fluorescence expression measurements were performed using a microplate reader or flow cytometer.
For measurements with the microplate reader, the experiment was conducted as follows: overnight liquid cultures of tested strains were diluted to OD600 0.2 and the diluted cultures were grown to OD600 0.5. From these cultures, cell culture was added to wells of a 96-well plate along with inducing hydrogen peroxide so that a final volume of 100 μL and a hydrogen peroxide concentration of up to 1 mM was reached. These cultures were grown on the 96-well plate, sealed with an optically clear adhesive film, with linear shaking. The microplate reader recorded OD600 and fluorescence at five minute intervals, with the excitation wavelength set at 502 nm and emission wavelength set at 528 nm. The growth medium was used as the blank for fluorescence and OD600 values. Blanked fluorescence was plotted either as a function of time or as a function of blanked OD600.
Fluorescence measurements with flow cytometry were performed as follows: overnight cultures of tested strains were diluted to OD600 of 0.2 and then grown to OD600 of 0.5. Induction samples were prepared by combining culture with hydrogen peroxide or microcystin so that the desired concentration of either hydrogen peroxide or microcystin and a final volume of 1.5 mL/2.2 mL was reached. These cultures were grown under normal conditions for two hours, after which final 1 mL samples for flow cytometry were prepared in PBS. For hydrogen peroxide samples, this was done by diluting the culture directly into PBS to reach an approximate final OD600 of 0.1, corresponding to a dilution of 1:5 – 1:10. For microcystin samples, cells were spun down and resuspended in PBS, likewise to a final approximate OD600 of 0.1. Measurements were done with BD FACSAria II (BD Biosciences) with a 530/30 bandpass filter. The following flow cytometer PMT voltages were used for the measurement; FSC 43, SSC 311, FITC 392. 10000 events were recorded per measurement.
Catalase Activity Assay
As catalase is responsible for degrading the hydrogen peroxide into oxygen and water, the foam layer can be assumed to be relative to the catalase activity level of the cell. Relative catalase activity levels of cells were obtained in terms of relative foam thickness (height divided by width). The assay, adapted from [16], was as follows: overnight cultures of the tested strains were resuspended into 2X PBS and diluted to a defined OD600 greater than 1.5. The cell solution was combined with an equal volume of microcystin solution to achieve a final volume of 1 mL, with different microcystin dilutions prepared into water. These mixtures were incubated for one or four hours. After the incubation, 0.5 mL of 30% H2O2 and 0.2 mL of 1% Triton X-100 were added to the mixtures, resulting in the formation of a foam layer. The foam layer was measured after five minutes.
Molecular and Mathematical Models
To validate the concept behind our detection mechanism and to improve the understanding thereof, two simplified molecular models representing the activation processes of the transcription factors Yap1p/Skn7p and Msn2/4p were created based on a review of the available literature.
The Yap1p/Skn7p model was then simulated using the COPASI software (version 4.19, build 140). In lieu of using experimental data, various ranges of reasonable parameter values were analyzed.
Enzyme Expression and Localization Analysis
Transformed S. cerevisiae SS328-leu cultures of 20 mL were grown in SD-leu medium with 2% glucose for 16h to high OD600 (> 5.0). They were then refreshed in 500 mL of fresh SD-leu medium containing 0.5% glucose for 5-6 h. OD600 at start of refreshment was diluted to around 0.2. MlrA was expressed under the GAL1 promoter with 2% galactose induction overnight, and the cells were harvested and stored at -20 °C. The growth medium was also concentrated and a sample was taken from it. This sample was expected to contain any secreted enzymes.
To separate the soluble protein and inner membranes from the inclusion bodies and cell debris, the cells were lysed accordingly: Cells were thawed and spun down 5 – 40 min, 3100 x g, at +4 °C, the supernatant was discarded and the pellet was resuspended with H2O to wash any residual growth medium. The cells were spun down again (5 min, 5000 x g, +4 °C) and supernatant discarded. The pellets were resuspended in lysis buffer (PBS with protease inhibitor mix, 10 mM PMSF, 1 mM DTT). Equal volume of acid-washed glass beads was added. Tubes were vortexed for 10 min in +4 °C. Samples were spun down (5 min, 5000 x g, +4 °C) to remove foam, and the supernatant (containing the inner membranes and soluble proteins) removed to a new tube. The glass beads were scooped out from the pellet and the pellets were resuspended in the same volume of PBS that they were spun down in.
Next the inner membranes were purified from the soluble proteins. 2 mL of sample (the supernatant from cell lysis) was transferred into ultracentrifuge tubes (13.5 mL, polycarbonate). The samples were centrifuged 160 000 x g, 1 h, +4 °C (rotor: Kontron, TFT 80.13 (r=6,42 cm)). The supernatants with the soluble proteins were removed to new tubes. The pellets containing the inner membranes were resuspended in 300 μL PBS + 5% glycerol buffer and homogenized on ice with a douncer.
To separate cell wall and plasma membranes from possible inclusion bodies, a refolding was performed to solubilize the inclusion bodies. Washing step: Pellets from cell lysis were resuspended in 1.5 mL of 50 mM Tris-HCl, pH 7.4, 4 M urea and sonicated for 40 min, 30% amplitude, 5 sec on/5 sec off. The samples were centrifuged at 12 000 x g, 10 min, RT, and the supernatant was collected. The washing step was repeated three more times. The supernatants were incubated at +37 °C for 1 h, shaking 230 rpm. 1-2 mL of 8M urea was added to both samples to get a clear solution. Clear samples were incubated in +37 °C for 1 h. Samples were dialyzed at 1:8 ratio against 20 mM HEPES pH 7.4, 10% v/v glycerol, 0.1 mM EDTA [25 mL:200 mL] at +4 °C overnight. Samples were concentrated and put to a second dialysis at a 1:50 ratio against the same buffer overnight, after which the samples were concentrated again. The pellet fractions from the washing step were expected to contain the cell wall and the plasma membranes, and the supernatants the refolded inclusion bodies.
To determine the localization of the expressed MlrA, samples from each step were taken and analyzed with SDS-PAGE and Western blotting. 25 μL of samples (10 μL in case of pellets due to their viscosity) were loaded onto 12.5% polyacrylamide gels of 1.0 mm thickness. Proteins were blotted onto nitrocellulose membrane using Trans-Blot Turbo Transfer System (Bio-Rad) with Turbo settings (25V, 2.5A, 7 min). Membrane was blocked with 3% BSA (Sigma Aldrich) in PBS-T for 1.5 h, then incubated with 1:30000 dilution of anti-His6 IgG peroxidase-labelled antibody (Sigma-Aldrich) in 3% BSA in PBS-T for 16h at +4 C. Membrane was then incubated with a 1:5000 dilution of rabbit anti-mouse IgG peroxidase-labelled antibody (Sigma-Aldrich) prepared in 1% skim milk (Valio) in PBS-T at room temperature for 1 h. Signal detection was done with WesternSure® ECL substrate (LI-COR Biosciences) following the manufacturer’s instructions. Digitized and chemiluminescent images were recorded with LAS-3000 Imager (Fujifilm).
Enzyme Activity Assay
To measure the activity of the expressed MlrA, reaction mixtures containing the enzyme diluted to 1:10, 1:100 or 1:1000 with PBS. Each mixture contained 0.1% BSA as blocking agent and 1 μg/L microcystin-LR. The amount of MC-LR corresponds to the safety limit set by World Health Organization [17], and has been used in previous experiments [14,18].
The reaction mixtures were incubated at +37 °C with shaking at 180 rpm, and samples of 100 μL were taken at certain time points. The enzyme was immediately deactivated with the addition of 100 μL methanol after sampling. The samples were analyzed with LC-MS to monitor changes in the relative amounts of the toxin over time. Samples were injected into Acquity UPLC system (Waters, Manchester, UK), equipped with a Kinetex® 1.7 µm C8 100 Å, LC column (50 x 2.1 mm). The UPLC was operated with a flow-rate of 0.3 ml/min in gradient mode, at +40 °C. Solvents used in the gradient were A: 0.1% formic acid in water and B: 0.1% formic acid in acetonitrile/isopropanol (1:1). The initial conditions of the linear gradient were A: 75% and B: 25% and the conditions were changed to A: 35% and B: 65% in 5 min. Injection volume was 1.0 μL. Mass spectra were recorded with a Waters Synapt G2-Si mass spectrometer (Waters, Manchester, UK). Measurements were performed using negative electrospray ionization (ESI) in resolution mode. Ions were scanned in the range from 500 to 1300 m/z. MS analyses were performed with scan times of 0.1 s. Capillary voltage was 2.5 kV, source temperature 120 °C, sampling cone 40.0, source offset 80.0, desolvation temperature 600 °C, desolvation gas flow 1000 L/h and nebulizer gas flow 6.5 Bar. Leucine-enkephalin was used as a lock mass and calibration was done with sodium formate and Ultramark 1621. The relative abundance of MC-LR was plotted against time to visualize the gradual degradation of the toxin.
Results and Discussion
Fluorescence induction with hydrogen peroxide
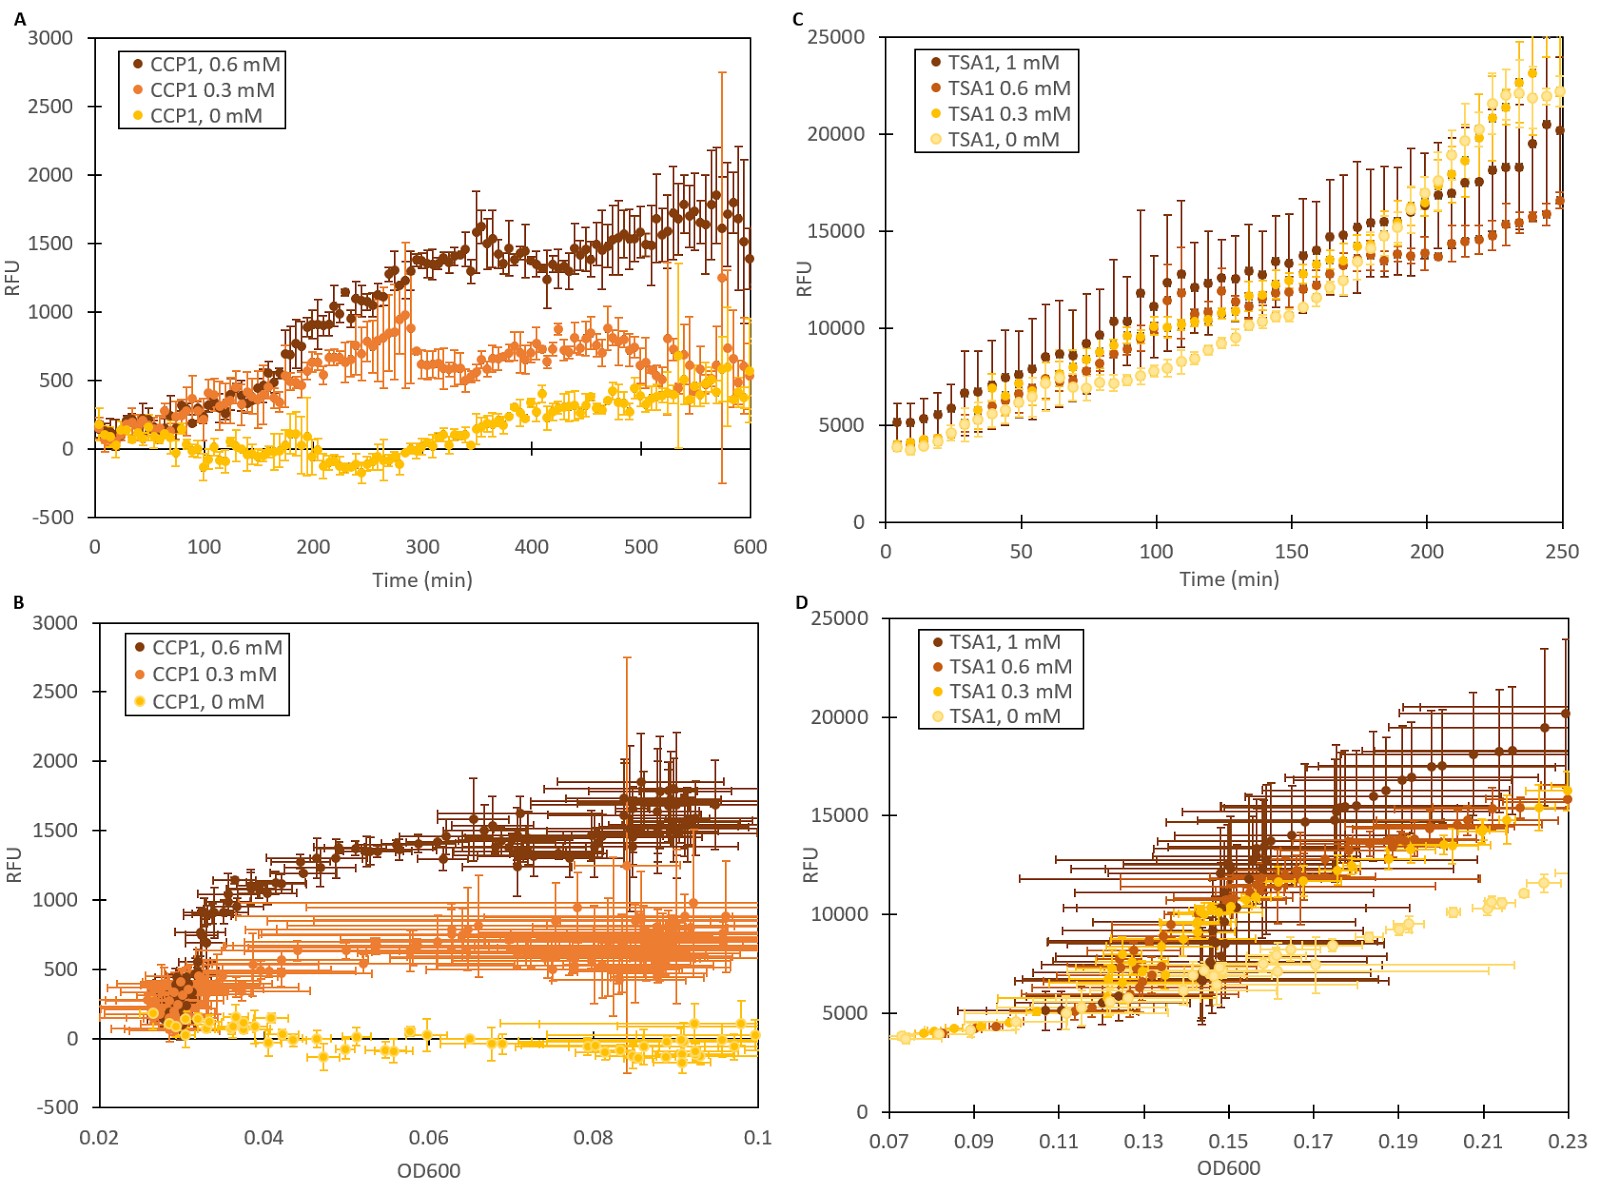
To validate our stress promoters’ functionality in yeast, yeast strains were transformed with vectors containing the Venus YFP gene under CCP1 and TSA1 promoters. An additional strain utilizing the constitutive GPD1 promoter to express YFP was created as a control. The GPD1 promoter is regulated by osmotic stress [19], but should not respond to oxidative stress. To test the expression of fluorescence under oxidative stress, cultures of the different strains were grown with different concentrations of hydrogen peroxide. The produced fluorescence was measured over time with a microplate reader (Figure 1). As seen in Figure 1A, CCP1 seems to produce greater fluorescent responses over time with higher induction concentrations. As it was noted that cells grew significantly slower in higher hydrogen peroxide concentrations [20], fluorescence had to be considered also relative to cell density. The general trend seen in 1A can be observed when normalizing fluorescence to cell density (Figure 1B), but the progressive increase in fluorescence with increasing induction concentrations is made even clearer. Meanwhile, the TSA1 promoter does not seem to respond to hydrogen peroxide with a clear fluorescent signal (Figure 1C), but plotting fluorescence against cell density reveals that when the effect of hydrogen peroxide on cell density is considered, the promoters seem to express slightly more fluorescence in the presence of hydrogen peroxide, although different concentrations do not have observable differences. The basal level of expression for TSA1 is high, however.
Additional verification of stress induction was obtained by measuring fluorescence with a flow cytometer (Figure 2). As seen in Figure 2A, absolute fluorescence values produced under GPD1 and TSA1 promoters are significantly higher than those produced under the CCP1 promoter. The CCP1 promoter seems to have a very low basal level of expression. Notably, the fluorescence seems to increase with hydrogen peroxide induction also in the control (GPD1 promoter). An explanation for this could be that since hydrogen peroxide slows culture growth, a relatively larger portion of the cells in the culture are older, meaning that they have accumulated more fluorescence. Because a defined number of cells are measured to obtain the fluorescence distribution, slower culture growth can show up as such a bias.
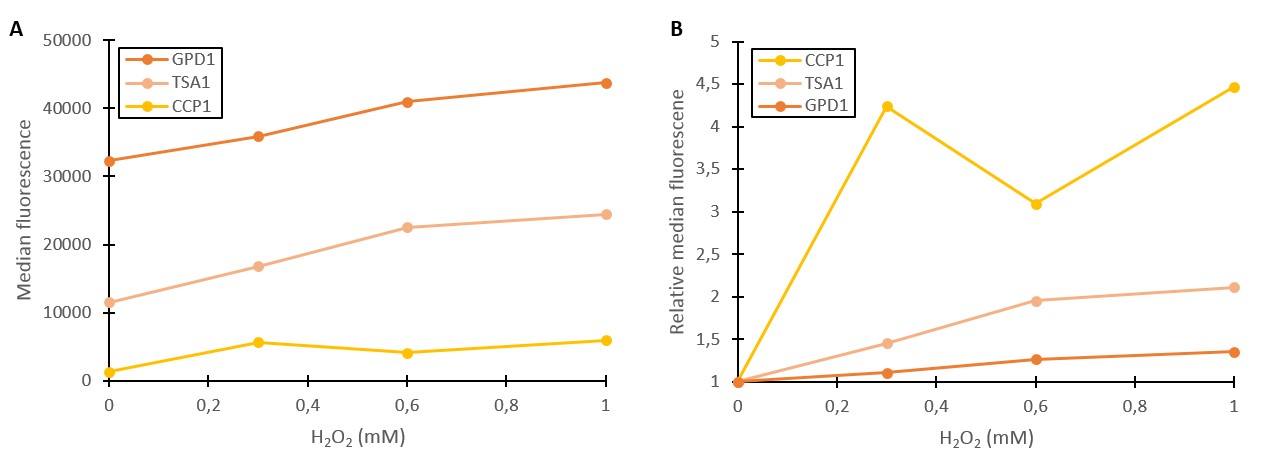
To account for this, fluorescence values were divided by the respective uninduced values of each promoter (Figure 2B). This shows that the relative increase in GPD1 fluorescence in higher hydrogen peroxide concentrations is significantly lower than for the stress promoters. Using this as a control for the stress promoters, it would seem that both stress promoters increase the expression of fluorescence in response to hydrogen peroxide, although for the CCP1 promoter, a control promoter with a lower, comparable expression level would be more accurate. Such a control would also help account for the fact that the relative fluorescences are more easily affected by small biases when the fluorescence levels are lower. Although additional repeats would be needed to further validate these results and better characterize the promoters’ responses to different induction concentrations, the fold change between uninduced and induced promoters (2B) gives strong indication that the tested stress promoters are working in principle. An important additional note is that although our tested CCP1 promoter clearly worked, its sequence did contain a single base mutation. Whether this difference has a positive or negative effect on the fluorescence would have to be confirmed by obtaining the correct promoter sequence.
Catalase activity measurement to verify microcystin import
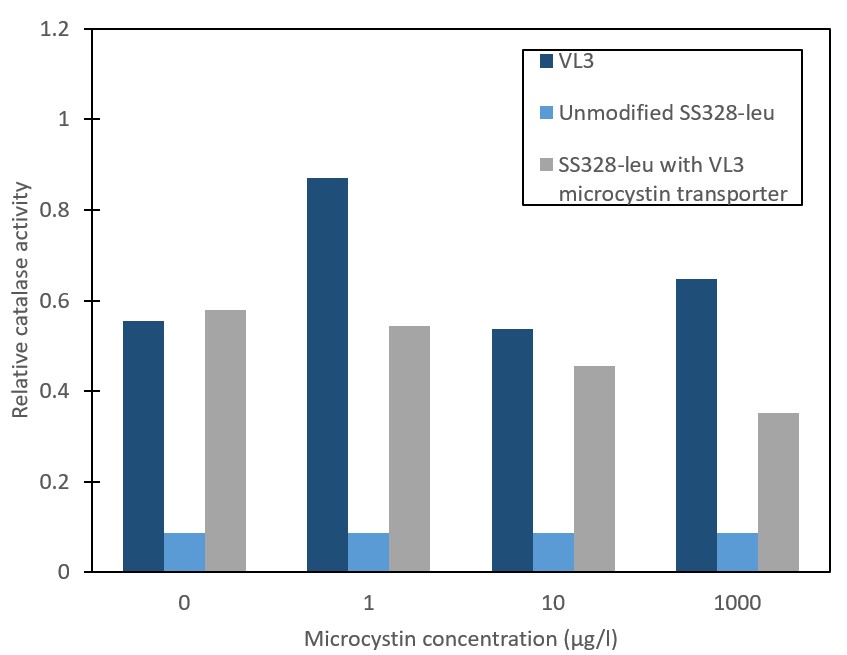
In order to verify our stress-based microcystin detection principle, we needed to enable and verify microcystin transport into yeast. The microcystin-importing QDR2 transporter from S. cerevisiae strain VL3 was integrated into the genome of S. cerevisiae strain SS328-leu. Successful integration was confirmed with antibiotic selection and PCR. Transporter functionality and microcystin import was assessed by measuring the relative catalase activity levels of different strains (Figure 3). The catalase activity response to the different microcystin concentrations in the microcystin-importing strain VL3 is observed to be similar to that reported previously by [9]. For the unmodified S. cerevisiae strain SS328-leu, observed catalase activities are low and show no response to microcystin. Implementation of the VL3 QDR2 transporter in SS328-leu was expected to create a catalase activity response corresponding to that observed in VL3. However, although a clear phenotype change is observed in the form of increased catalase activity basal levels, the expected response to microcystin did not occur. Because more replicates would be needed to gain further verification and more accuracy on the different strains’ response to microcystin, the possibility of the phenotype change indicating microcystin transporter functionality was not ruled out.
Fluorescence induction with microcystin
To test stress promoter induction with microcystin, vectors containing Venus YFP constructs were transformed into the S. cerevisiae SS328-leu strain with the integrated QDR2 transporter. These strains were incubated with different concentrations of microcystin. Strains with the unmodified transporter were used as controls. Two strains containing the GPD1 promoter with and without the microcystin transporter served as a control for changes between transporter variants for a promoter unaffected by microcystin. The produced fluorescence was measured with flow cytometry (Figure 4).
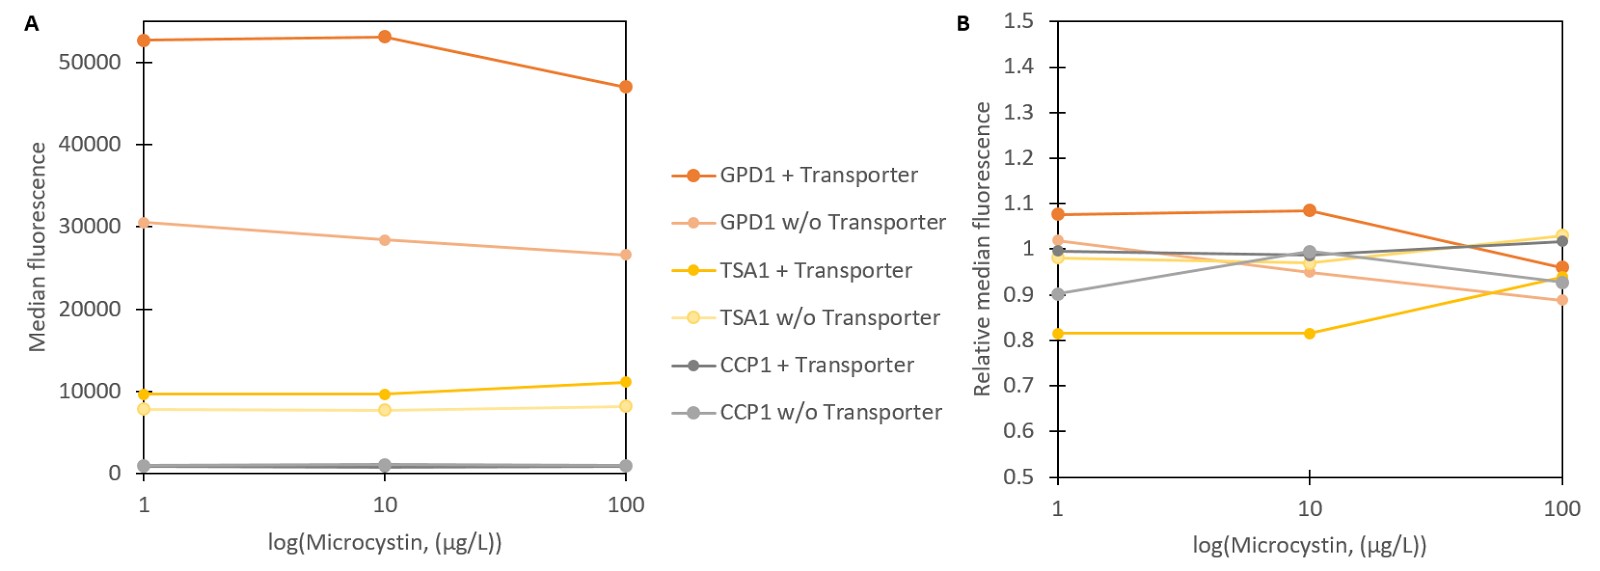
As seen in Figure 4A, none of the strains seems to show a notable fluorescent response to microcystin. Normalizing the fluorescence values to uninduced concentrations further confirms that none of the produced fluorescence changes are significantly different from the controls. There are two possible explanations for this; either microcystin does not induce the promoters as hydrogen peroxide does, or microcystin is not being imported into the cell. Faulty transporter functionality seems the more plausible explanation overall. Despite the phenotype change after integrating the microcystin transporter, the previous results showed no indication of microcystin producing the expected response inside the cell, thus indicating that microcystin is not imported.
It is possible that as a strep-tag was incorporated on the C-terminus of the transporter, the tag interferes either with the correct expression and localization of the transporter, or with its function. Additionally, the obtained amino acid sequence for QDR2 contained one unclear amino acid, which was either a leucine or isoleucine. For the tested construct, isoleucine was chosen for this position, but it is possible that the original transporter contains a leucine instead. Furthermore, the observed phenotype change might not require the functionality of the new transporter, as long as the original transporter is removed. As the function of the VL3 QDR2 transporter is largely unknown, it is possible that it does not have the hydrogen peroxide antiporter functionality that the normal yeast QDR2 transporter has (SGD ID: S000001383). As a result, removal of the original transporter would allow hydrogen peroxide accumulation in the cell, leading to an increased catalase activity basal level, regardless of the functionality of the integrated VL3 transporter. This would explain the phenotype change in absence of a functional microcystin importer.
Detection System Simulations
To better understand the detection system, simplified molecular models were created for the activation processes of Yap1p/Skn7p and Msn2/4p based on the current understanding of the gene regulatory networks. A graphical representation of these is presented in Figures 5 and 6.
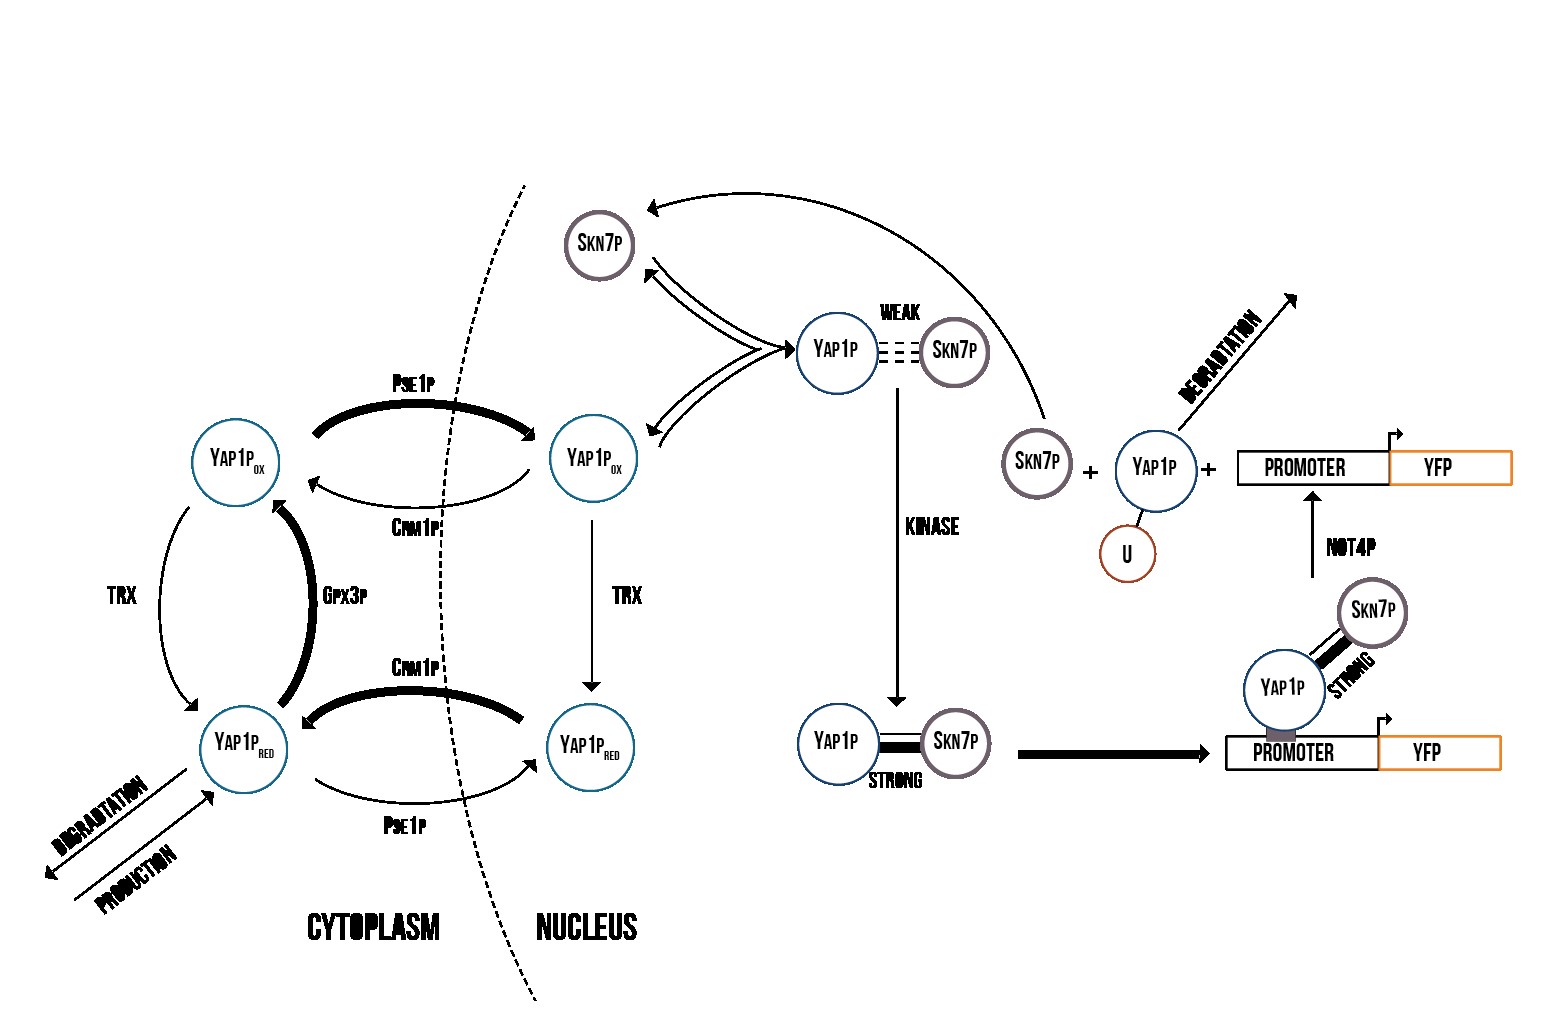

Figure 5 presents the activation process of Yap1p/Skn7p. During stress, Gpx3p oxidizes Yap1p, which is therefore localized into the nucleus [21]. In the nucleus, the oxidized Yap1p forms a weak bond with Skn7p, which is turned into a strong bond by an unknown kinase [22]. The Yap1p/Skn7p complex then binds to the promoter regions of genes involved in the cell’s oxidative stress response.
In Figure 6 the activation process of Msn2/4p can be seen. Hydrogen peroxide formed during oxidative stress oxidizes thioredoxin [23], which then inhibits the function of a kinase that normally prevents the nuclear import of Msn2/4p. This causes Msn2/4p to localize into the nucleus [21] following which the nuclear Msn2/4p binds to the promoter regions of OSR genes.
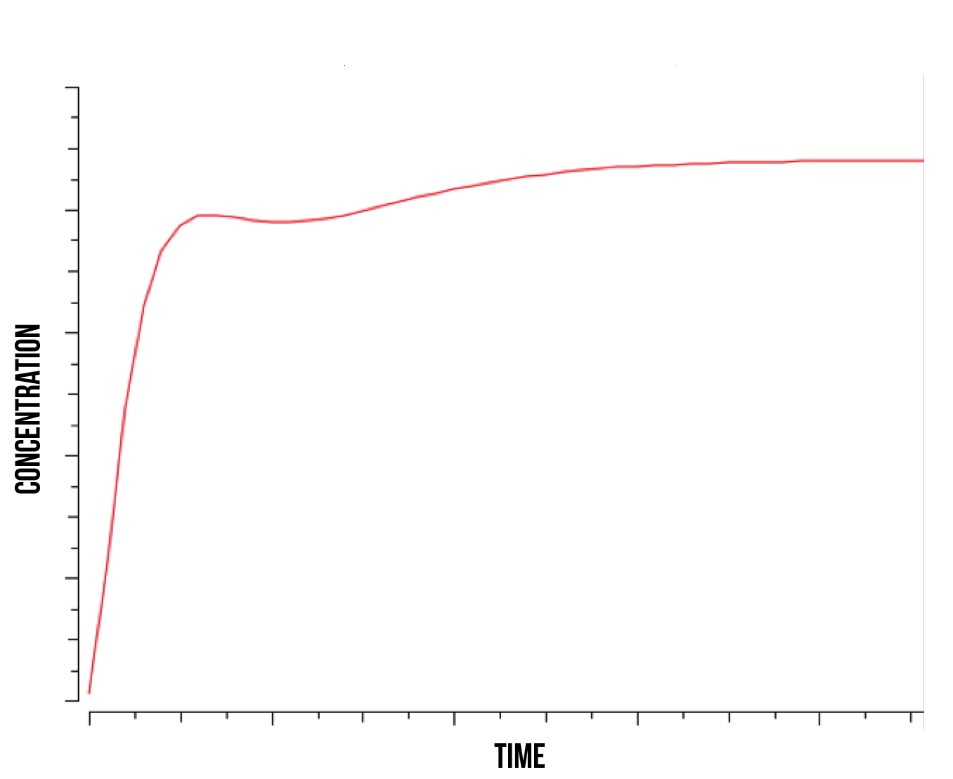
Simulation results from our COPASI simulation indicate that Yap1p and Skn7p are involved in the cell’s immediate response to stress, and are therefore suitable for use in a detection mechanism. In Figure 7, we show the theoretical concentration of active YFP-coding genes in the cell as a function of time. In addition, our model supported the mechanism suggested by [24] where YAP1P degradation is driven by the activity of NOT4 inside the nucleus.
More detailed information regarding the modelling results can be found at [25].
Expression of microcystinase in S. cerevisiae
We produced and analyzed two variants of microcystinase (MlrA) to find the best way to express it in S. cerevisiae. The coding sequence for MlrA from Sphingomonas sp. ACM-3962 (GenBank accession number AF411068.2) was codon optimized for S. cerevisiae by GeneArt. Our first variant had the coding sequence for MlrA with a 6xHis-tag fused to its C-terminus. The second variant had a mating factor α tag fused to its N-terminus in addition to the C-terminal 6xHis-tag to assess its effect on the expression and localization of the enzyme.
After expressing the enzymes the cells were lysed and the lysate was centrifuged. Samples were taken from all points of processing and analyzed with western blot. The results in Figure 8 shows that both variants were expressed. The calculated size of MlrA with a His-tag is 37 kDa. However, our results show a band corresponding to a protein of about 28 kDa. This is the same size we obtained when producing MlrA in E. coli [13]. The smaller than expected size was also established by Dziga et al., who discussed that the smaller size might be due to protease activity specific to E. coli, as the expected MlrA size was observed when producing MlrA heterologously in Staphylococcus aureus [9]. The results from Dziga et al. also indicated that any cleavage of the enzyme would happen on the N-terminus, as the C-terminally fused His-tag was not cleaved. Our results support this, as our constructs had the His-tag on the C-terminus, similar as in [9]. This indicates that there might be similar proteolytic activity in S. cerevisiae as there is in E. coli with regard to this enzyme.
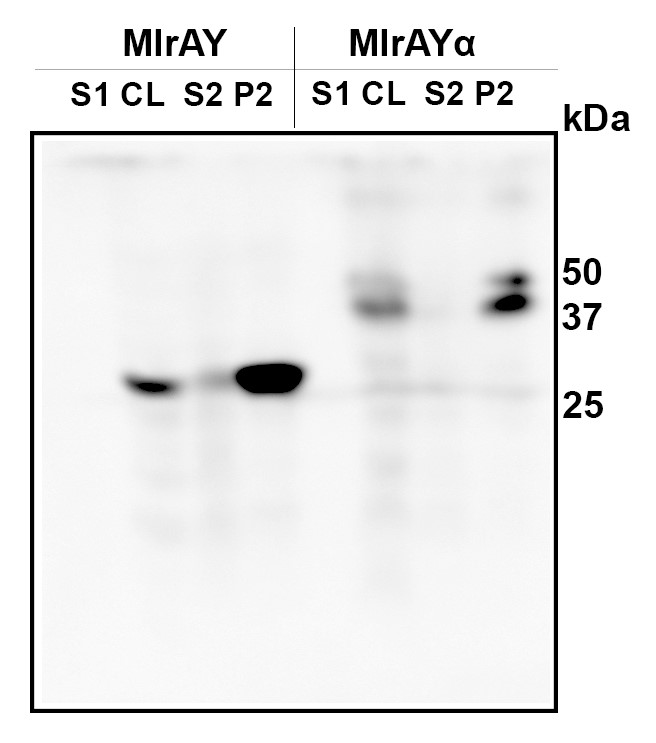
Expression of MlrA with the mating factor α tag resulted in a protein of about 38 kDa, which corresponds to the calculated size of MlrA. It is possible that the secretion tag in the N-terminus protects the enzyme from any presumed proteolytic cleavage, although the secretion tag itself is apparently cleaved off during processing, as expected: the calculated mass of the construct containing the signal sequence is about 47 kDa.
Microcystinase localization in S. cerevisiae
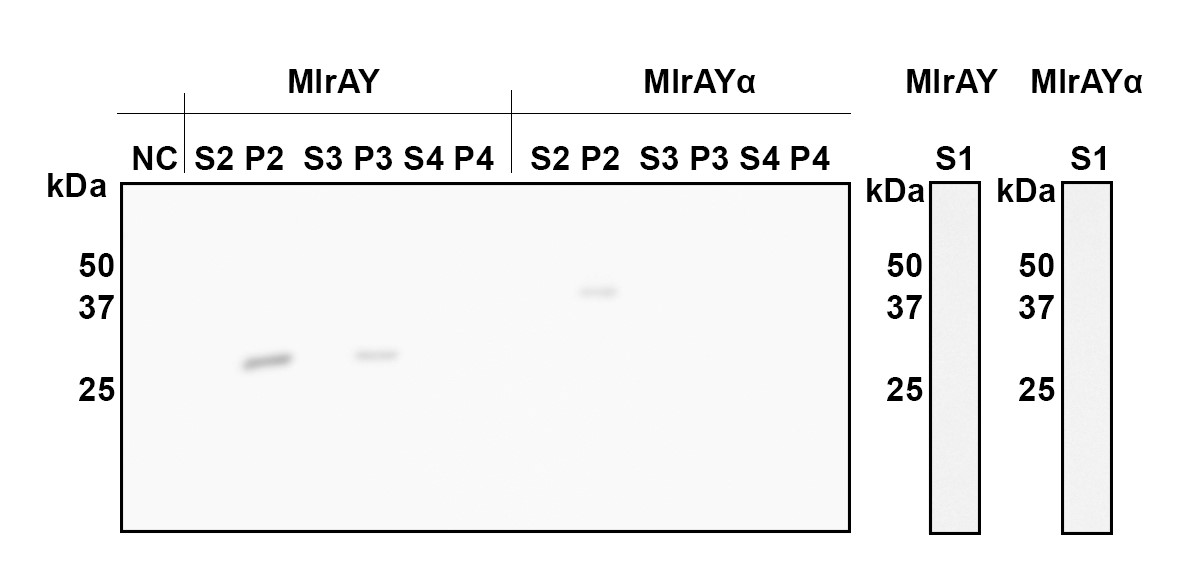
Cellular fractions were analyzed to verify enzyme localization. More detailed analysis of the different fractions of the cell indicated that both constructs localize in the fraction comprising of inclusion bodies, plasma membrane and cell wall (Figure 9, P2 fraction). MlrA without a tag (MlrAY in Figure 9) was also localized in the fraction containing only the cell wall and plasma membrane (P3), indicating that the protein is localized in the plasma membrane. The absence of MlrA with the tag (MlrAYa) in the fractions after the renaturing step (Figure 9, S3 and P3) is most likely due to technical errors in the experiment, and based on this we are unable to conclude whether the protein is in the plasma membrane or in the inclusion bodies.
Microcystin degradation
In order to test the activity of the produced enzymes, they were tested with microcystin to assess toxin degradation. Enzyme activity assays were performed for the cellular fractions containing the inclusion bodies, cell walls and plasma membranes (Figure 9, P2). S. cerevisiae not containing a microcystinase construct was used as a negative control.
The results for the degradation assay, plotted in Figure 10, show that the amount of microcystin-LR is decreasing over time, suggesting that the enzyme is active and is degrading the toxin. However, since the exact amounts of MC-LR and MlrA in the samples were not known, no quantitative analysis of the reaction could be done, e.g. to calculate reaction kinetics. Additionally, because of its high affinity to plastic, MC-LR had to be handled with glassware such as Pasteur pipettes, which resulted in less accurate measurements. Nevertheless, the procedure was sufficient to test whether the enzyme was active.
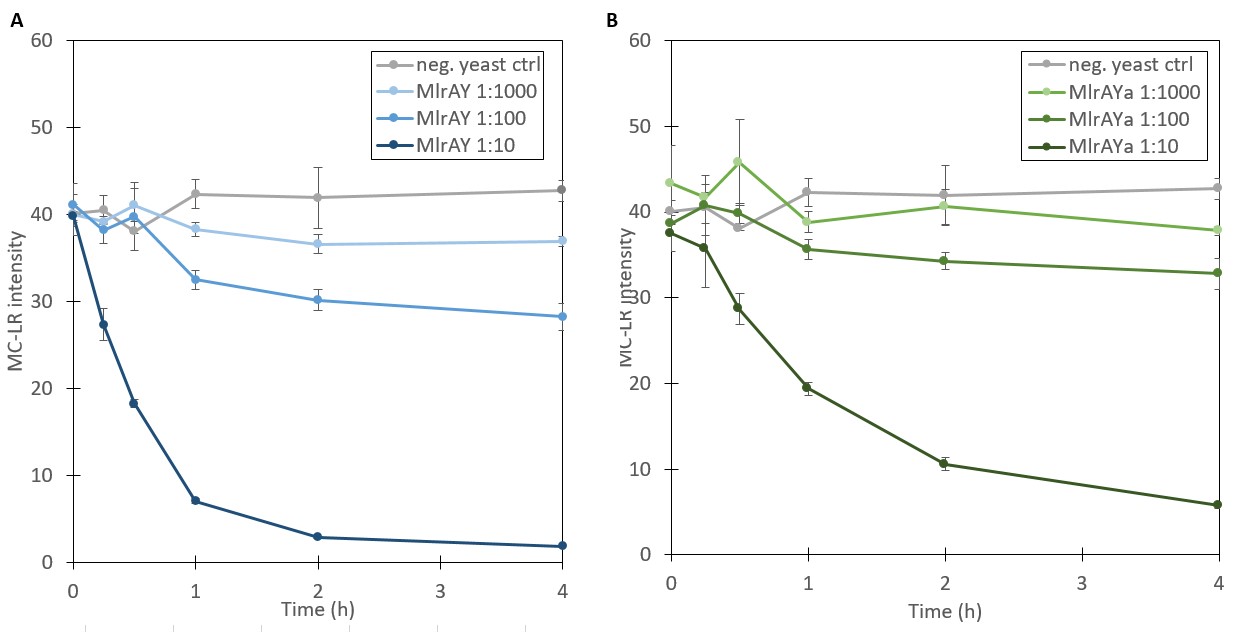
The results of the activity assay provide more verification on localization results. Based on the localization we were able to say that MlrA resides in the plasma membrane, but we were unable to definitively conclude the localization of MlrA with the mating factor α beyond that it localized into the fraction containing the plasma membrane, cell wall, and inclusion bodies. However, because both enzyme variants exhibited activity degrading microcystin, localization in inclusion bodies seems unlikely. Based on this, we are able to conclude that both most likely reside in the plasma membrane.
Conclusion
We verified the functionality of two stress promoter devices (TSA1 and CCP1) by testing their expression with hydrogen peroxide induction. The basal level of TSA1 fluorescence was rather high, and relative changes were rather small. Still, it clearly seemed to be upregulated by oxidative stress. For the CCP1 promoter, YFP expression basal level was near zero, absolute values of induced fluorescence were much smaller, but relative values were significantly greater. Thus, amplifying the fluorescent signal could make the CCP1 construct a viable oxidative stress sensor. Our molecular models support the viability of using these promoters in sensor purposes. According to our simulations, mechanisms based on the response to oxidative stress have good potential for detection mechanisms, as they suggest a fast response of the cell based on the transcription factors our promoters rely on.
We have a good proof of concept showing that both promoters are induced by oxidative stress using hydrogen peroxide, but more experimental work would have to be done to confirm their viability in detecting oxidative stress caused by microcystin. In order to validate this, continued work on the VL3 strain QDR2 microcystin transporter would be essential. Different variants of the transporter would have to be used in further experiments. Additionally, analysis of the expression of the transporter could produce information on the localization of the transporter. This would aid in confirming potential transporter inactivity and the reason behind it. Integrating the transporter into a different locus in the genome or expressing it in a plasmid while leaving the original transporter intact could also help pinpoint the source of unexpected transporter function.
In the case that our promoters were not functional with microcystin induction, they could have uses in other purposes. As the concept of our promoter devices is precisely to respond to oxidative stress, they could be utilized for different applications centered around this idea. We hypothesized that in fresh waters, microcystin is one of the strongest factors causing oxidative stress, and thus, our promoters would give a signal relative to its concentration. However, there are many other agents that cause oxidative stress, such as heavy metals, UV radiation, xenobiotics and air pollution [26], and thus our device could be used for studying their combinatory effect and monitor stress levels in the form of a fluorescence signal.
We demonstrated that active microcystinase can be produced in S. cerevisiae. Combining our enzyme activity and localization analyses, the most likely localization of microcystinase in S. cerevisiae seemed to be the plasma membrane. This supports previous accounts of the enzyme being a putative membrane protein. Further research would have to be conducted in order to get quantifiable data about the enzyme. More detailed comparison of microcystinase production and activity levels between S. cerevisiae and E. coli would outline potential benefits of choosing a specific production host for the enzyme.
To further develop the concept of degrade microcystin from contaminated water enzymatically, a few points are worth acknowledging. Even though the microcystins are the most common cyanobacterial toxins, there are several others produced by the bacteria which this enzyme cannot degrade. In addition, to make the degradation complete, other enzymes from the microcystinase enzyme set would have to be utilized, as MlrA only linearizes the toxin. For most purposes, however, linearization would likely bring toxin concentrations to safe levels. The enzyme would likely be more effective in detoxifying small quantities of water retrieved from lakes than actual bodies of water themselves. Going back to the matter of sauna being an integral part of Finnish culture, the enzyme could be designed to detoxify a bucket of lake water prior to use in the sauna. The degradation would be carried out at room temperature to maintain enzyme activity, and the enzyme itself would degrade later when exposed to the hot temperatures of the sauna – a scenario that is both practical and environmentally safe. The enzyme’s specificity for the unique amino acid Adda would likely make enzyme-purified water safe to use for humans and other animals, although further investigation would be required to verify the absence of harmful side effects.
Responses to Reviewers
A transcript of the reviewer comments and author responses from the Live Peer Review Jamboree can be found here: Aalto University-University of Helsinki Responses to Reviewers
Acknowledgements
LC-MS analysis was carried out by Matti Wahlsten from the Cyanobacteria group at the University of Helsinki.
We want to thank our supervisors and everyone else who has helped and supported us during our iGEM journey. In particular, special thanks go to David Fewer from the University of Helsinki, Alexander Frey, Jorg de Ruijter, Pezhman Mohammadi and Georg Schmidt from Aalto University, and Merja Penttilä, Jussi Jäntti and Dominik Mojzita from the VTT Technical Research Centre of Finland.
References
- Lürling M, Oosterhout Fv, Faassen E. Eutrophication and Warming Boost Cyanobacterial Biomass and Microcystins. Toxins. 2017;9(2):64.
- Kotovirta V, Toivanen T, Järvinen M, Lindholm M, Kallio K. Participatory surface algal bloom monitoring in Finland in 2011–2013. Environmental Systems Research. 2014;3:24.
- Koivula T. (Transl. Ratia M.) Novel Testing Device Will Reveal Whether Water Contains Toxic Blue-green Algae. University of Turku, 2014 [cited 26 Feb 2017]. Available: http://www.utu.fi/en/news/articles/Pages/Novel-Testing-Device-for-Blue-green-Algae.aspx
- Welgamage Don DON, A. C. D. An investigation into the biodegradation of peptide cyanotoxins (microcystins and nodularin) by novel Gram-positive bacteria. 2012; Available from OpenAIR@RGU. [online]. Available from: http://openair.rgu.ac.uk
- Campos A, Vasconcelos V. Molecular mechanisms of microcystin toxicity in animal cells. Int J Mol Sci. 2010;11(1):268–287.
- Lone Y, Koiri RK, Bhide M. An overview of the toxic effect of potential human carcinogen Microcystin-LR on testis. Toxicol. Rep. 2015;2(2015):289-296.
- Chen J, Xie P, Lin J, He J, Zeng C, Chen J. Effects of microcystin-LR on gut microflora in different gut regions of mice. J Toxicol. Sci. 2015;40(4):485-494.
- He XJ, Fassler JS. Identification of novel Yap1p and Skn7p binding sites involved in the oxidative stress response of Saccharomyces cerevisiae. Molecular microbiology. 2005;58(5):1454-1467.
- Valério E, Vilares A, Campos A, Pereira P, Vasconcelos V. Effects of microcystin-LR on Saccharomyces cerevisiae growth, oxidative stress and apoptosis. Toxicon. 2014;90:191-198.
- Bourne DG, Riddles P, Jones GJ, Smith W, Blakeley RL. Characterisation of a gene cluster involved in bacterial degradation of the cyanobacterial toxin microcystin LR. Environ Toxicol. 2001;16(6):523-34.
- Bourne DG, Jones GJ, Blakeley RL, Jones A, Negri AP, Riddles P. Enzymatic pathway for the bacterial degradation of the cyanobacterial cyclic peptide toxin microcystin LR. Appl. Environ. Microbiol. 1996;62(11):4086-4094.
- Pei J, Mitchell DA, Dixon JE, Grishin NV. Expansion of type IICAAX proteases reveals evolutionary origin of g-secretase subunit APH-1. J. Mol. Biol. 2011;410:18-26.
- iGEM Aalto-Helsinki 2016. Aalto-Helsinki 2016 Description. In: Aalto-Helsinki 2016 [Internet]. 2016 [cited 16 Jan 2017]. Available: http://2016.igem.org/Team:Aalto-Helsinki/Description
- Dziga D, Wladyka B, Zielińska G, Meriluoto J, Wasylewski M. Heterologous expression and characterisation of microcystinase. Toxicon, 2012;59(5):578-586.
- Aalto-Helsinki 2016 – research group on protocols.io. Life Sciences Protocol Repository. Protocols.io. 2017 [cited 19 Jan 2017]. Available: https://www.protocols.io/groups/aaltohelsinki-2016
- Iwase T, Tajima A, Sugimoto S, Okuda KI, Hironaka I, Kamata Y, et al. A simple assay for measuring catalase activity: a visual approach. Sci. Rep. 2013;3:3081.
- WHO, 2003. Cyanobacterial toxins: Microcystin-LR in drinking-water. Background document for preparation of WHO Guidelines for drinking-water quality. Geneva, World Health Organization (WHO/SDE/WSH/03.04/57).
- Edwards C, Graham D, Fowler N, Lawton LA. Biodegradation of microcystins and nodularin in freshwaters. Chemosphere. 2008;73(8):1315-1321.
- Albertyn J, Hohmann S, Thevelein JM, Prior BA. GPD1, which encodes glycerol-3-phosphate dehydrogenase, is essential for growth under osmotic stress in Saccharomyces cerevisiae, and its expression is regulated by the high-osmolarity glycerol response pathway. Mol. Cell. Biol. 1994;14(6):4135-4144.
- iGEM Aalto-Helsinki 2016. Aalto-Helsinki 2016 Laboratory. In: Aalto-Helsinki 2016 [Internet]. 2016 [cited 16 Jan 2017]. Available: http://2016.igem.org/Team:Aalto-Helsinki/Laboratory
- Lushchak VI. Oxidative stress in yeast. Biochemistry. 2010;75(3):281-296.
- He XJ, Mulford KE, Fassler JS. Oxidative stress function of the Saccharomyces cerevisiae Skn7 receiver domain. Eukaryot Cell. 2009;8:768–778.
- Boisnard S, Lagniel G, Garmendia-Torres C, Molin M, Boy-Marcotte E, Jacquet M, et al. H2O2 Activates the Nuclear Localization of Msn2 and Maf1 through Thioredoxins in Saccharomyces cerevisiae. Eukaryot Cell. 2009:8(9):1429–1438.
- Gulshan K, Thommandru B, Moye-Rowley WS. Proteolytic degradation of the Yap1 transcription factor is regulated by subcellular localization and the E3 ubiquitin ligase Not4. J Biol Chem. 2012;287:26796–26805.
- iGEM Aalto-Helsinki 2016. Aalto-Helsinki 2016 Modelling. In: Aalto-Helsinki 2016 [Internet]. 2016 [cited 16 Jan 2017]. Available: http://2016.igem.org/Team:Aalto-Helsinki/Modelling
- Farrugia G, Balzan R. Oxidative Stress and Programmed Cell Death in Yeast. Front Oncol. 2012;2:64.
Supporting Information
S1 MlrA expression. Digitized and chemiluminescent images of enzyme expression in Western blot. Molecular weights are indicated on digitized image and samples are indicated on chemiluminescent image. Refer to Fig. 8 for legend. Asterisks represent data that have not been discussed in this report. S1 MIrA Expression
S2 MlrA localization. Digitized and chemiluminescent images of localization assay by Western blot. Molecular weights are indicated on digitized image and samples are indicated on chemiluminescent image. Refer to Fig. 9 for legend. S2 MIrA Localization