iGEM REPORT: Development of a bioluminescence-based whole-cell biosensor for air pollution monitoring
Note: This iGEM Report was submitted to the PLOS iGEM Realtime Peer Review Jamboree, and has not undergone formal peer review by any of the PLOS journals. We welcome your comments on this work.
Development of a bioluminescence-based whole-cell biosensor for air pollution monitoring
C. Soucies (1), C. Chenebault (1), B. Piot (1), V. Plet (1), T. Jaisser (1), C. Lapierre (1) *
- Institut Sup’Biotech de Paris, Paris, France
*Corresponding author: clement.lapierre@gmail.com
Author Contributions
Investigation: CS, CC, BP, CL
Writing – Original Draft: CS, CC, CL
Writing – Review & Editing: CS, CC, BP, CL, TJ, VP
Visualization: CS, CC, BP, CL, TJ, VP
Funding Acquisition: CL, CS, CC, TJ, VP, BP
Supervision: CL, CS, CC, BP
Abstract
Air pollution is a major issue, especially in urban areas where levels of pollutants are constantly on the rise. The concentration of such pollutants as Volatile Organic Compounds (VOCs) is poorly measured even though they are known to have numerous harmful effects, among which carcinogenicity, reproductive toxicity, and environmental toxicity. This is mostly due to a lack of appropriate detection technology. Existing tools present major flaws, such as long exposition times or large device size, that prevent any efficient VOC detection. In this article, we propose a new technology for VOC detection. This technology, based on a whole-cell biosensor, presents numerous advantages over existing devices and is especially suitable for on-field measurements. Unlike existing biosensor reporters, we chose to use bioluminescence as the quantifiable reporter signal. Luciferase genes have been extensively used as an imaging tool but few articles report their use as a reporter gene. We engineered E. coli strains to constitutively produce the XylR protein, a transcription factor capable of binding VOCs. Once bound to these compounds, the XylR-VOCs complex activates the Pu promoter. This promoter triggers the expression of the luciferase reporter gene. Engineered E.coli cells were treated with several concentrations of toluene and the bioluminescence intensity of the cells was measured. The bioluminescence intensity of the cells was proportional to the amount of toluene added to the cell culture medium. To better investigate the reliability of the obtained results, the effect of toluene on cell survival was assessed, along with the best possible measurement time after toluene exposure. The on-field advantages of whole-cell biosensors were demonstrated through the construction of a prototype drone. The drone acts as a mobile detection platform for sampling and mapping purposes. In conclusion, we developed a proof-of concept innovative biosensor and proved it to be functional, opening the way for further work on bioluminescence-based biosensors.
Financial Disclosure
Funding was provided by the Ionis Education Group, Biomatters, Berthold technologies GmbH, Fisher Scientific GmbH, New England Biolabs GmbH, Integrated DNA Technologies, Qiagen, INSERM U1138 Team 1. However, the funders had no role in study design, data collection and analysis, decision to publish, or preparation of the manuscript.
Competing Interests
The authors have declared that no competing interests exist.
Data Availability
All data are fully available without restriction: http://2016.igem.org/Team:Ionis_Paris
Introduction
Air pollution is an ever-increasing concern, especially in urban areas. Air pollution is generally described as the presence of gas and particles in the outside air with harmful impact on human health and/or on the environment. Air pollution is a complex phenomenon as pollutants are numerous, originate from many sources and as many factors impact air pollution. Pollutants may come from natural phenomena (volcanic eruptions, organic matter decomposition, forest fires) as well as human activities (industry, transport, farming and residential heating) [1]. Volatile Organic Compounds (VOCs) are among the most harmful pollutants. VOCs are organic chemicals with a high vapor pressure (0.01kPA) at room temperature (293.15K = 20°C). Their high vapor pressure results from a low boiling point, which causes large numbers of molecules to evaporate from the liquid or sublimate from the solid form of the compound and enter the ambient air, a trait known as volatility [1] [2]. VOCs have been increasingly investigated over the last years. These primary pollutants originate from fuel evaporation, car traffic, industrial processes, heating systems in residential area, domestic use of solvents but also from vegetation. Although they represent only 2% of the pollutants found in the air [2], VOCs, especially BTEX (Benzene, Toluene, Ethylbenzene, Xylene), were shown to have many harmful effects, such as carcinogenicity, reproductive toxicity, and multiple systemic effects [3]. They also acidify water, soil, impact vegetal growth [3] and play a role in secondary particles and ozone formation [4][5]. The estimated cost of these premature deaths in WHO countries is $ 1.6 trillion per year. [5] To protect populations and the environment against those harmful effects, the concentrations of those pollutant needs to be monitored and a threshold of 5 μg/m3 needs to be guaranteed.
The number of different pollutant molecules is so important that no universal detection technology is possible. Various technologies exist for every pollutant, and they have mainly been classified in two main groups: Active and Passive. A study of the existing methods for VOC detection can be found in Table 1. As we can see in Table 1, the existing technologies for VOC detection are either not reliable or accurate but costly, consuming energy and requiring big machines. It has been proved that the biggest pollution variations are recorded within a 20m range around a highway [2], hence proving the need for a detection technology made of a small device, adapted to small-scale pollution measurements. Biotechnology and synthetic biology are promising alternatives to existing technologies as they provide small and compact measurements devices.
![Table 1 Existing VOC measurement methods. [7][8][9][10][11]](https://collectionsblog.plos.org/wp-content/uploads/sites/15/2020/05/Table-1.jpg)
We engineered E.coli bacteria to constitutively produce the XylR protein and express the reporter gene Gaussia luciferase [18][19] under the control of the Pu promoter. Once produced, the Gaussia luciferase oxidizes its substrate (coelenterazine) to produce bioluminescence. Bioluminescence presents several advantages over chromoproteins or fluorescence, such as increased sensitivity, and allows quantitative measurement of the reporter signal[19][20][21].
Using a mobile detection platform, such biosensor may enable quick and precise on-field measurement of air pollution.
Materials and Methods
Chassis
The Escherichia Coli strain DH5α was used as chassis for the plasmids. Indeed, this strain grows easily and has several mutations that make it an excellent choice for cloning procedures with a high efficiency transformation. All designed plasmids have been optimized for E. Coli. Moreover, E. Coli is a model organism, entirely sequenced.
Plasmids
The plasmid backbone mainly serves as support for the propagation of the biobrick part. It includes the origin of replication and the antibiotic resistance marker. The pSB1C3 plasmid, a high copy number assembly plasmid, was used as a vector of 2070 pb, because it is the most widely used type of backbone to assemble DNA fragments. This plasmid backbone includes the chloramphenicol resistance marker and a high copy replication origin, which allows a high copy number per cell, facilitating DNA purification.
BioBrick RFC [10] assembly standard
For the assembly of DNA fragments the BioBrick RFC [10] assembly standard was used because it is the standard of the IGEM competition and most of the parts available on the registry match this standard. The BioBrick RFC [10] assembly standard is based on the use of a prefix and a suffix placed at the extremities of each part to be assembled in order to obtain standard BioBricks that are compatible and thus easily assembled (Figure 1). Prefix and suffix, each include two different restriction sites. EcoRI and XbaI in the prefix, SpeI and PstI in the suffix. The use of this assembling method leaves a scar between the 2 assembled DNA fragments.
![Fig. 1 Assembling method with RFC[10] standard. Fragment 1 is digested using SpeI et PstI while fragment 2 is digested using XbaI and PstI. During the ligation, fragment 2 is inserted after fragment 1 thanks to the matching DNA extremities left by the enzyme couple SpeI/XbaI.](https://collectionsblog.plos.org/wp-content/uploads/sites/15/2020/05/Fig.-1.jpg)
Primers Design
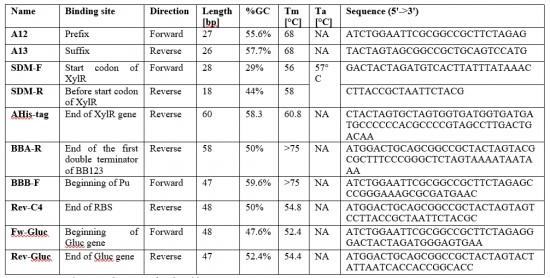
Ten primers (Table 2) were designed using the Geneious software to amplify the DNA fragments that compose our plasmids. Six primers (Table 3) were designed using Geneious to sequence plasmids. The primers were synthetized by Eurofins.

Toluene evaporation test
Toluene is known to be a volatile compound. Therefore, it was important to determine its rate of evaporation before proceeding to any subsequent manipulation. The care when handling it will be determine using the data from this test data as well as the length of time the stock solution will be kept. 1.2mL of pure toluene (244511, Sigma-Aldrich) was added in a 1.5mL Eppendorf tube. The tube was left open under a chemical hood and its weight was determined every 30 min for 6 h.
Toluene survival test
A large range of concentrations (from 5ng/L to 5mg/L) was tested in order to evaluate the overall impact of toluene on the E.coli DH5α cell growth. 5ng/L is a concentration close to environmental toluene concentrations. An overnight culture of bacteria transformed with our biosensor was realized. 300µL of this overnight culture was inoculated into 150mL of LB containing chloramphenicol at 25ng/mL. This culture was homogenized and separated into several Falcon tubes. Toluene was then added to the culture medium to reach desired concentrations and the sample’s OD600 was checked every hour during 8 h. Three replicates of each concentration were done to ensure reliable statistical results.
Biosensor characterization
It was decided to test several concentrations of toluene (0ng/L, 10ng/L, 100ng/L, 10µg/L and 10mg/L). Bioluminescence assays were realized several times after toluene addition (after 1h, 3h, 4h30 and 5h30). Bacteria transformed with the biosensor used in each assay come from the same culture (OD = 0.1). This culture was mixed and divided into 50 mL falcons. Toluene was then added into each Falcon. Bioluminescence assays were realized shortly after substrate addition and the bioluminescence intensity was measured using a Mithras² LB 943 Monochromator Multimode Reader. This machine was kindly lent by Berthold Company for 3 days in order to let us carry out the bioluminescence measurement. In addition to bioluminescence intensity, sample’s OD was also measured.
All tests were realized in triplicates. Several negative controls were performed:
– Measurement of the bioluminescence intensity of bacteria transformed with a genetic construction that do not contain the Gaussia luciferase gene (Pr-XylR).
– Measurement of LB bioluminescence intensity to determine the background noise.
– Measurement of LB+toluene bioluminescence intensity to determine toluene effect on the bioluminescence intensity.
A positive control using a Gluc coding device with Pr (BBa_K2023007) could have been made during the three days of measurement to test substrate efficiency and luminometer parameters. However, this BioBrick was created afterwards. Yet, it will serve as a future control for all future bioluminescence assays to ensure the substrate efficiency.
Results
Toluene evaporation test
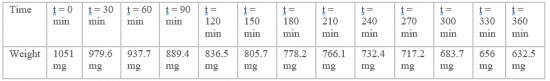
Toluene was experimentally proven to be a volatile compound: left open under a chemical hood, 419 mg of pure toluene have evaporated from the tube within 6 hours. These results show that toluene evaporates with a rate of 72 mg per hour. However, we supposed that this rate could have been increased by the action of the chemical hood. Important care has to be taken when manipulating toluene. Each test realized with toluene will be done under a chemical hood. Tubes containing toluene must be closed throughout the whole manipulation in order not to decrease the toluene concentration. The stock solution of toluene will be prepared again for each replicate.
Cell survival test to toluene
Figure 2 shows the evolution of sample optical density (OD600) according to the time and the toluene concentration added in cell culture medium. The curve shows normal growth profile with a lag phase of three hours and then an exponential phase for all samples no matter what toluene concentration is added in the cell culture medium.
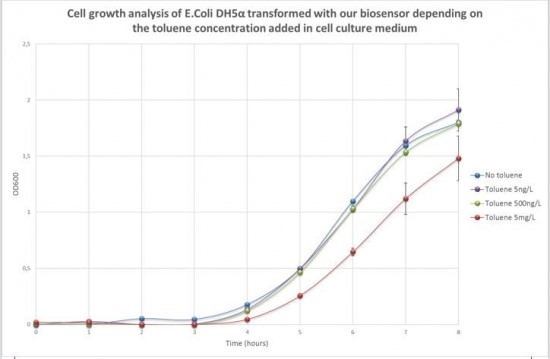
Toluene addition at a concentration of 5ng/L and 500ng/L did not significantly affect cell development. The growth curve shows the same profile than cells grown without toluene. At a concentration of 5mg/L of toluene in the medium, an effect on cell development can be noticed. Four hours after toluene addition, the OD600 of cells grown in 5mg/L of toluene increased more slowly than the OD600 of cells grown without toluene.
In compliance with those results, bioluminescence tests were performed with a toluene concentration in the culture medium between 0 and 10 mg/L.
Biosensor characterization
Preliminary considerations
Toluene does not produce background noise. The effect on bioluminescence intensity of toluene addition to cell culture medium was determined. As shown in Figure 3A the bioluminescence intensity of the LB with toluene at 10 mg/L (47.71 RLU) does not significantly differ from the bioluminescence intensity of the LB without toluene (48.93 RLU). The small recorded signal was due to the substrate added in our sample. Therefore, toluene addition in samples will not impact the bioluminescence intensity.

E.coli bacteria have little background noise. Bacteria transformed with a genetic construction that does not contain Gaussia luciferase gene were used in this study. The background noise of E.coli cells was assessed comparing E.coli bacteria bioluminescence intensity with LB background noise. As shown on Figure 3B, the background noise of E.coli cells (53.14 RLU) was a little superior to LB background noise (48.93 RLU) but not significantly superior. E.coli cells have little background noise production. However, this signal is greatly inferior to the one produced by our biosensor in presence of pollutant.
Little leakage in Gaussia luciferase expression. We investigated the inducibility of the Pu promoter to ensure that the Gaussia luciferase is not constitutively produced in our biosensor. To do so we compared the bioluminescence intensity of bacteria containing our biosensor to the bioluminescence intensity of bacteria transformed with a genetic construction that does not contain the Gaussia luciferase gene (BB12: Pr-RBS-XylR), both in a hermetically sealed tube. The obtained results (Figure 3C) indicate that the Gaussia luciferase gene is not produced in a constitutive manner in the cells. The bioluminescence intensity of our biosensor without toluene injection (158.86 RLU) is a little higher than the bioluminescence intensity of cells transformed with BB12 (53.14 RLU). However, this bioluminescence intensity is significantly lower than the bioluminescence intensity of the cells transformed with our biosensor in presence of toluene (results shown in the next section).
Due to the little LB background noise and leakage in Gaussia luciferase synthesis, obtained bioluminescence intensity results were treated as follows. The background noise (LB+toluene) was subtracted to each sample’s bioluminescence intensity. The data was then normalized in function of the negative control.
Bioluminescence assays results
Investigation of the best measurement time. It was first necessary to determine when, after toluene injection, bioluminescence results were the most relevant. To do so, the bioluminescence intensity of our sample (bacteria transformed with the biosensor within LB medium containing different toluene concentrations) was determined several times after toluene addition. The bioluminescence intensity of the negative control was also determined at each time after toluene addition, and bioluminescent results for each assay were normalized on the corresponding negative control bioluminescence intensity. This normalization was necessary as we are dealing with several incubation times. This enables to handle the bacteria OD increase within our samples, and ensures that an increase in sample’s bioluminescence intensity is not correlated with an increase in cells concentration. The graphs Figure 4 represents the bioluminescence intensity of the samples depending on the time after a toluene addition for a constant concentration of injected toluene.

The bioluminescence intensity of all the samples was compared to the bioluminescence intensity of the negative control for each time after toluene injection. Mann Whitney statistics tests were realized to determine whether the bioluminescence intensity of the sample was significantly higher than the bioluminescence intensity of the negative control. On the graphs, we can notice that the bioluminescence intensity increases as the time after toluene injection increases. However, as to the highest concentration (10 mg/L) (Figure 4D), a decrease in the bioluminescence intensity can be noticed 5h30 after toluene injection. It is due to the accumulation of Gaussia luciferase and the impact of toluene on the cell metabolism and especially protein synthesis. Therefore, it is essential to realize bioluminescence tests at a precise time after sampling. As it is the environmental toluene concentration (less than 20ng/L) that is targeted, it is suitable to wait 5h30 before proceeding to the bioluminescence test. Bacteria were not incubated with toluene for a longer time because of the effect of toluene on E.coli cells. We thought that this effect would decrease the biosensor sensitivity and precision.
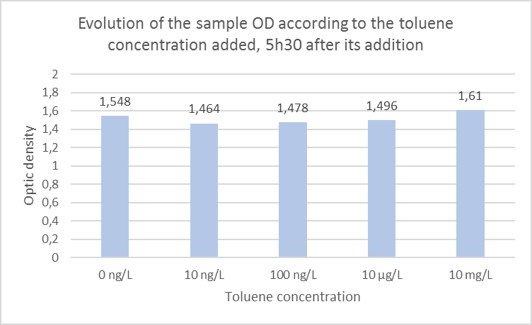
Investigation of detectable concentration 5h30 after toluene addition to the cell culture medium. As it was determined that it is preferable to wait 5h30 before the bioluminescence assay, it was decided to focus on the results obtained after that length of time after toluene addition in the cells medium. Evolution of the bioluminescence intensity was studied according to the toluene concentration added in the cells medium 5h30 before. Those tests were realized in triplicates. First of all, it was ensured that the OD of the different samples was the same 5h30 after bacteria inoculation in presence of toluene. As shown on Figure 5, the sample’s ODs are quite similar going from 1.464 to 1.61.
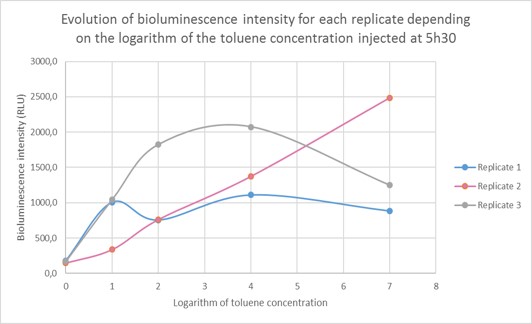
The bioluminescence intensity of each sample was then determined and shown depending on the toluene concentration. As we are dealing with extremely different toluene concentrations, it was preferable to give our results in function of the logarithm of the toluene concentration. The bioluminescence intensity data in RLU for each replicate (R1, R2, R3) are given in the table below and represented on Figure 6. As shown on the graph, the obtained data differ from one replicate to another due to difference in metabolism, which is normal when working with living organisms. However, the curve profile stays the same: the bioluminescence intensity of the sample increases until a toluene concentration of 10 µg/L, then it reaches a plateau for two replicates and continues to increase for the third replicate. Those results were pooled in order to draw a standard curve and enable to predict toluene concentration in a sample according to the bioluminescence intensity.
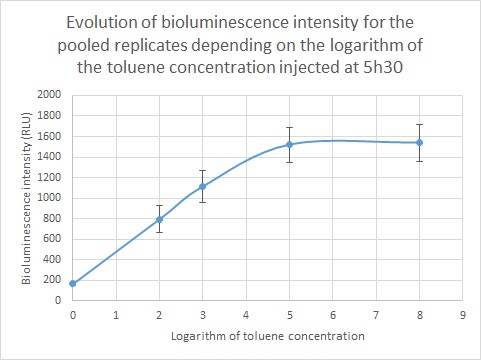
Quantification of environmentally relevant toluene concentration. Figure 7 shows the evolution of the bioluminescence intensity depending on the logarithm of toluene concentration. For a toluene concentration inferior to 10µg/L (10,000 ng/L: log (4)) the curve increases steadily, then the curve reaches a plateau. This can be due to Gaussia accumulation in the cells. We were able to detect environmentally relevant toluene concentration and as the standard curve is linear for a toluene concentration inferior to 10µg/L, we are able to quantify the toluene concentration of a given sample.
Perspectives
5h30 after toluene injection, the biosensor is able to detect environmentally relevant toluene concentration (10ng/L). This way of pollutant detection is environmentally friendly, as bacteria only require the appropriate molecules in its culture medium to grow and quantify pollutant. In addition, the use of a biosensor, even if it requires an expensive machine (a luminometer) for result analysis, is cheaper compared to other existing methods, physical or chemical. However, the biosensor is only a prototype and different improvements still have to be made.
Based on the results afore mentioned, we thought about improvement and future experiments that still have to be made. First of all, the standard curve drawn is based on few different toluene concentrations. This standard curve can be improved by focusing on low toluene concentration and by realizing bioluminescence assays for lower toluene concentrations. The lowest concentration the biosensor can detect has to be determined while ensuring precise and reproducible results. Moreover, CelloCad software can be used to optimize the genetic circuit.
The variations between the different replicates have to be pointed out for bioluminescence assays. Those variations are due to metabolism variations of living organisms. Several measurements have to be realized for each toluene concentration and the reproducibility of the results have to be assessed on more experiments. Also, the bioluminescence assay protocol has to be optimized and the different parameters of the luminometer have to be tested.
Tests with other pollutants such as xylene must be performed. Therefore, the sensibility of the biosensor to those pollutants should be assessed in future experiments. For a convenient reason, and as it was not possible to evaporate toluene within the laboratory, bioluminescence assays were only performed using liquid toluene. Future work could consist in the creation of an isolated and hermetic room in which gazeous toluene could be added in order to perform air sampling with the drone.
Acknowledgements
We would like to thank all the people that helped the project at some point: Damien LASSSALLE and all the other team members, of course, but also our advisors (Alexandre ISMAIL, Samuel JUILLOT, Matthieu DA COSTA, Frank YATES and Estelle MOGENSEN), our sponsors, the media that spoke about us and the people that were here to support us. Our schools have been supporting our project since the beginning, whether by funding it, granting us access to a lab, allowing some time for our presentations in the planning, lending us the European Experience building, publishing articles about us… The IONIS education group took a big part in our project, and we are very proud that we managed to gather 6 IONIS schools to work on such a big scale project for the first time in history. We are very grateful to Vanessa Proux, director of Sup’Biotech, for her patience, her availability and her constant support when we needed help, or when we wanted to reach some other school directors. We also thank all the people at Glowee for their support and help when we needed lab material or emergency advice. Special thanks to Mr. JAISSER and Mr. LECHNER from the INSERM U1138 Team 1 for their answers and availability. They have always been very willing to help and they have provided us with precious support and guidance. Pierre OUGEN, head of Sup’Biotech’s Innovative Projects, for lending us a spectrophotometer and a NanoDrop during the project. Davis DU PASQUIER and Andrew TINDALL for their help while analyzing our results. Thomas MARQUES and the Berthold Company for lending us a luminometer, without which our results would have been of a far lesser quality. Thomas LANDRAIN, Cléa BAUVAIS and Marc FOURNIER from the La Paillasse staff, for their help and support. Lastly, many thanks to all the people who took part to the PLOS iGEM Peer-Review event, whose advices were very helpful.
Response to Reviewers
A transcript of the reviewer comments and author responses from the Live Peer Review Jamboree can be found here: Ionis Response to Reviewers
References
[1] Monnoyer-Smith, L., Bottin, A. (2015). “Bilan de la qualité de l’air en France en 2014 et principales tendances observées sur la période 2000-2014”, Commissariat Général au Développement Durable.
[2] AIRPARIF, association for air quality monitoring in Ile de France (France)
[3] 7 million premature deaths annually linked to air pollution, WHO , 2015
[4] “Air pollution costs European economies US$ 1.6 trillion a year in diseases and deaths”, WHO News Release, April 28th, 2015
[5] Ministère de l’Ecologie, du Développement Durable et de l’Energie (2012). “Bilan de la qualité de l’air en France en 2012 et principales tendances observées sur la période 2000-2012”
[6] Poulleau, J. (2011). “Bulletin de la mesure et de la caractérisation des polluants dans les rejets atmosphériques N°1: Mesure des Composés Organiques Volatils”, Institut national de l’environnement industriel et des risques INERIS.
[7] Bousse, L. (1996). “Whole cell biosensors”. Sensors and Actuators B: Chemical 34, 270–275, available here
[8] Charrier, T., Jos, M., Affi, M., Jouanneau, S., Gezekel, H., and Thou, G. (2010). “Bacterial Bioluminescent Biosensor Characterisation for On-line Monitoring of Heavy Metals Pollutions in Waste Water Treatment Plant Effluents.” In Biosensors, INTECH Open Access Publisher, available here
[9] Behzadian, F., Barjeste, H., Hosseinkhani, S., and Zarei, A.R. (2011). “Construction and Characterization of Escherichia coli Whole-Cell Biosensors for Toluene and Related Compounds.” Current Microbiology 62, 690–696, available here
[10] Institut national de l’environnement industriel et des risques INERIS (2010) “Stratégie de mesure des niveaux de concentration en benzène, toluène, éthylbenzène et xylènes dans l’air ambiant autour d’installations classée ”, Study Report INERIS-DRC-10-112289-10754A, available here
[11] Fernández, S., Lorenzo, V., and Pérez-Martin, J. (1995). “Activation of the transcriptional regulator XylR of Pseudomonas putida by release of repression between functional domains.” Molecular Microbiology 16, 205–213, available here
[12] Gerischer, U. (2002). “Specific and global regulation of genes associated with the degradation of aromatic compounds in bacteria.” Journal of Molecular Microbiology and Biotechnology, 4(2), 111- 122, available here
[13] Salto, R., Delgado, A., Michán, C., Marqués, S., & Ramos, J. L. (1998). “Modulation of the function of the signal receptor domain of XylR, a member of a family of prokaryotic enhancer-like positive regulators.” Journal of Bacteriology,180(3), 600-604, available here
[14] Tropel, D., & Van Der Meer, J. R. (2004). “Bacterial transcriptional regulators for degradation pathways of aromatic compounds.” Microbiology and Molecular Biology Reviews, 68(3), 474-500, available here
[15] Jarque, S., Bittner, M., Blaha, L. & Hilscherova, K. ”Yeast Biosensors for Detection of Environmental Pollutants: Current State and Limitations”, published in Trends in Biotechnology, Volume 34(5), 408-419 (2016), available here
[16] Nunes-Halldorson, V. da S., and Duran, N.L. (2003). “Bioluminescent bacteria: lux genes as environmental biosensors.” Brazilian Journal of Microbiology 34(2), available here
[18] Wille, T., Blank, K., Schmidt, C., Vogt, V., and Gerlach, R.G. (2012). “Gaussia princeps Luciferase as a Reporter for Transcriptional Activity, Protein Secretion, and Protein-Protein Interactions in Salmonella enterica Serovar Typhimurium.” Applied and Environmental Microbiology 78(1), 250–257, available here
[19] Wu, N., Rathnayaka, T., and Kuroda, Y. (2015). “Bacterial expression and re-engineering of Gaussia princeps luciferase and its use as a reporter protein.” Biochimica et Biophysica Acta (BBA) – Proteins and Proteomics 1854(10A), 1392–1399, available here
[20] Selifonova, O., Burlage, R., and Barkay, T. (1993). “Bioluminescent sensors for detection of bioavailable Hg(II) in the environment.” Appl. Environ. Microbiol. 59(9), 3083–3090, available here
[21] Wood K. (2011) “The bioluminescence advantage”, LaboratoryNews, available here